Social Media Analytics: The Definitive Guide
We are sure you will agree with us when we say:
“Social media analytics can be confusing and time-consuming.”
One look at the long list of metrics available is enough to overwhelm even the most hardened social media manager.
Never mind working out how to interpret them all.
But, it doesn’t have to be this way.
There is an easy method to understand and use social media metrics.
In fact, it can make the process simpler, faster and more time-efficient than you thought possible.
Leaving you with more time to focus on your strategy and making a difference to your followers.
You know, the stuff you love.
In this guide, we are going to show you how to unlock the power of social media analytics, and finally use them to your advantage.
Read on to find out more.
Table Of Contents
Why You Need Social Media Analytics
Social media analytics help you to become a social media manager who gets their audience.
They make you smarter, more empathetic and provide you with a clear vision of what your fans/followers/users/customers want or need.
Let’s face it:
We all know social media usage reveals a lot about people.
What they like, share, comment on and subscribe to can provide clear insight into who they truly are.
(Or, at least, who they want to be.)
This is great news for you:
Because the data their actions create leaves a trail of breadcrumbs to your ideal social media strategy.
Social media analytics allow you to see the real-time impact of your updates:
- You can track what works, what doesn’t, and how well you are engaging people.
- You can see if your updates are creating owners and leaders, or if you are just another page in a busy news feed.
These metrics go way beyond vanity metrics and “doing it for the likes.”
“Going viral is not an outcome; it’s a happening. Sometimes it happens; sometimes it doesn’t. Just remember, fans are vanity and sales are sanity.”
Every action you take creates a data imprint, and if you interpret the results correctly, they can have real practical implications for your business.
Let us explain:
Where Social Media Meets Your Sales Funnel
When gurus exclaim:
“Don’t sell on social media!”
they are wrong.
Really wrong.
Why?
Because all social media is selling, even if we don’t realize it.
Social media sits right at the top of your sales funnel in the “awareness” section.
It’s one of the first entry points into your funnel:
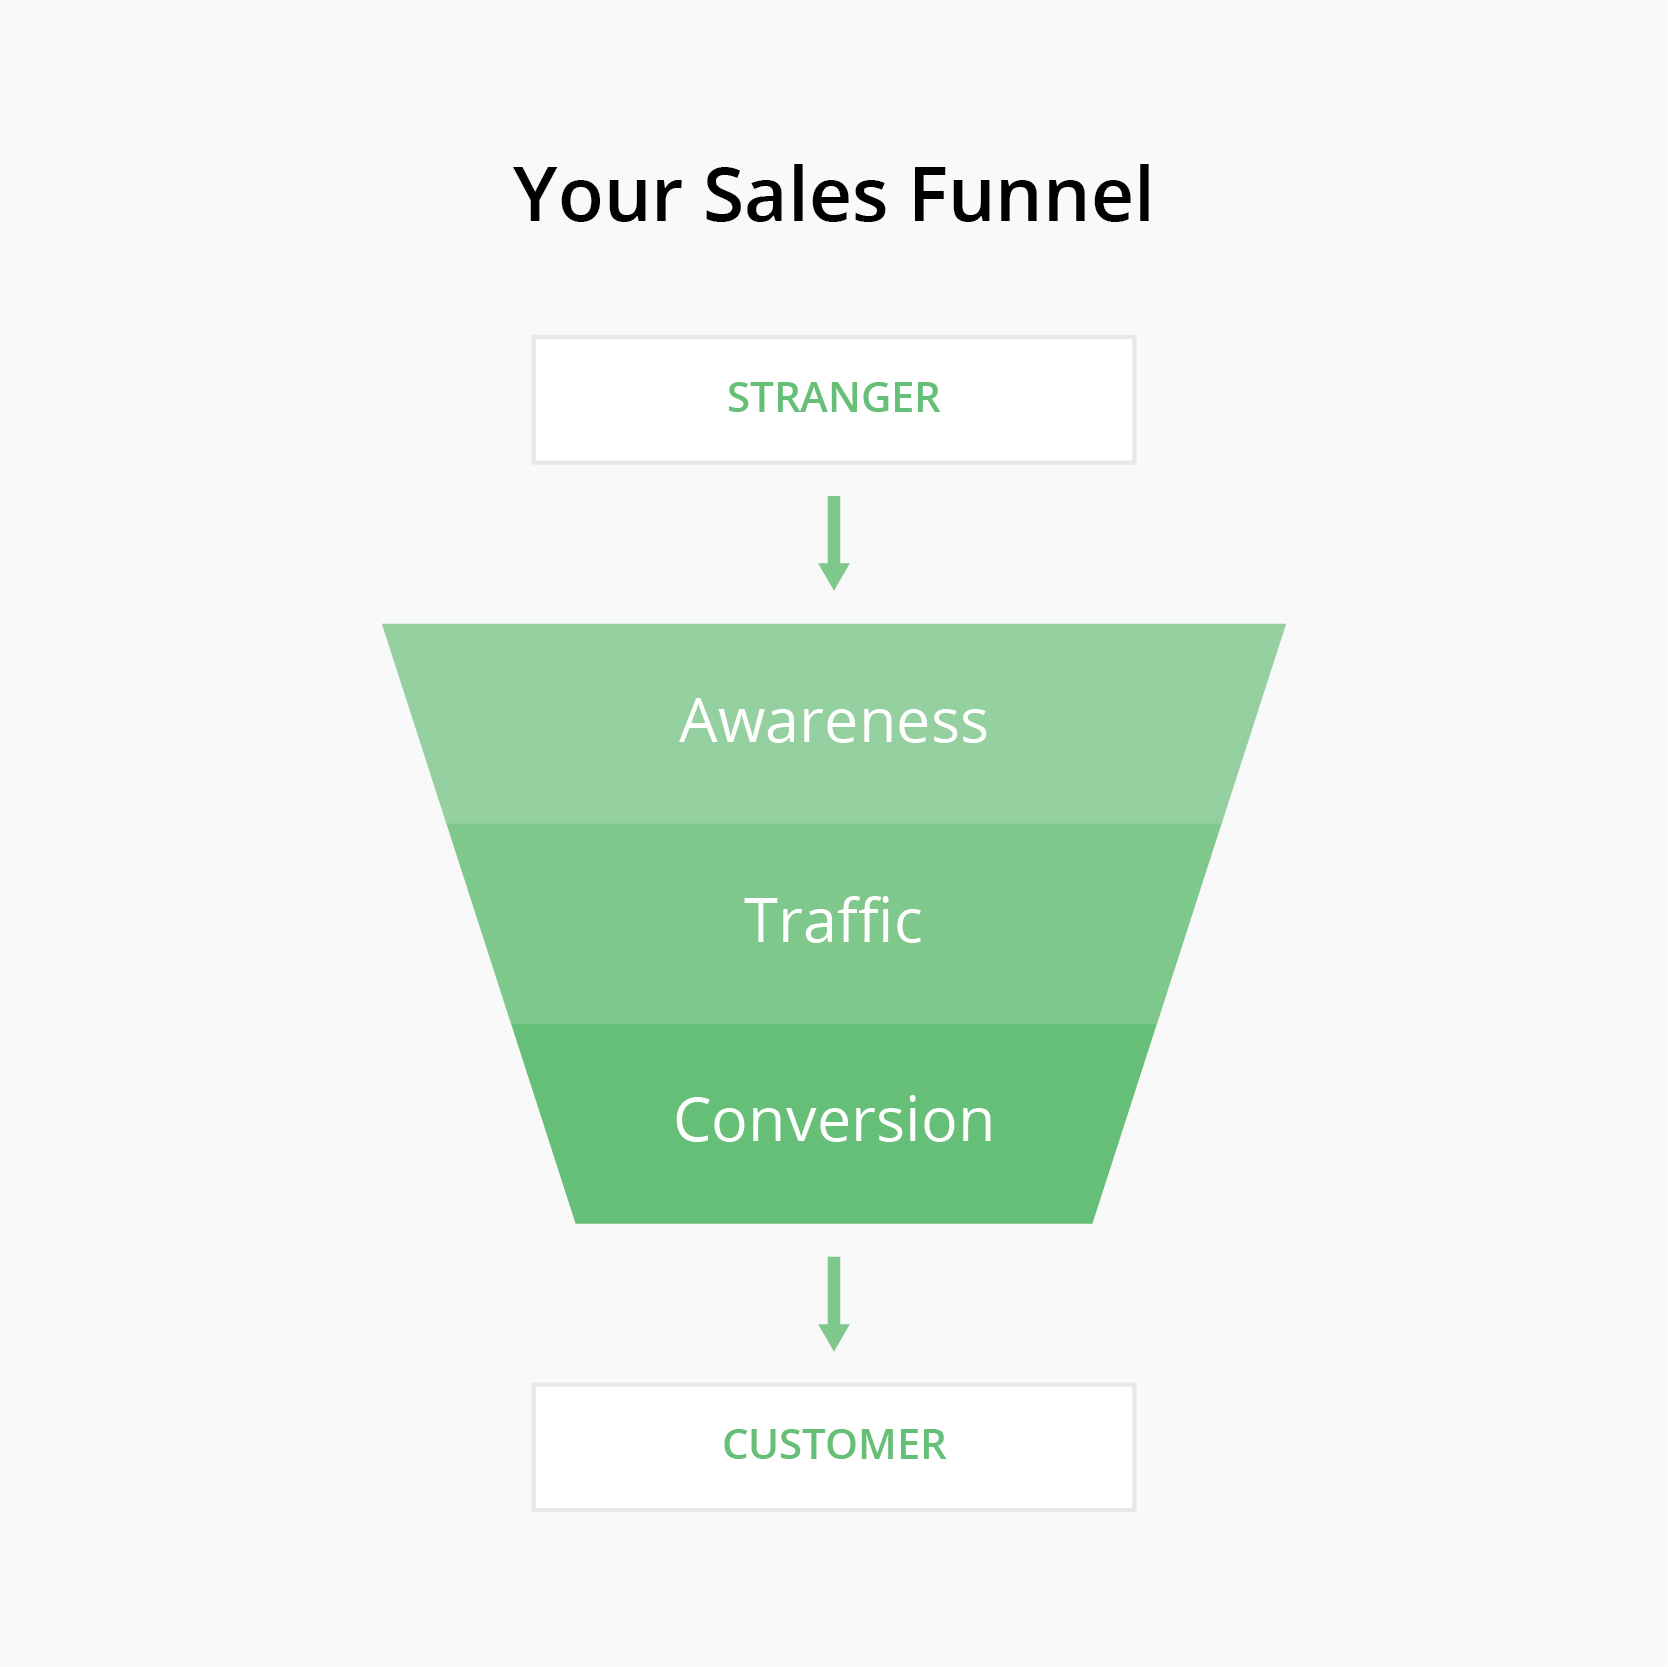
At the awareness stage, people are looking for:
- Answers
- Insights
- Data
- Entertainment
When they see one of your updates, and it ticks the right box, they’re pulled into your sales funnel. They have become aware you exist online, and the sales process begins. They are now primed and ready to be moved onto the next level, traffic. To do this, they might read a blog post or download a podcast episode. If your content is good enough, they’ll jump onto the next stage, conversion.
Depending on your business, a conversion might look like:
- E-commerce: product purchase.
- SaaS: sign up for your free trial, or outright product purchase.
- Blog: email subscription.
- Service business: appointment, reservation or consultation booking.
- Mobile app: download.
Social media analytics help you to see everything that happens in the awareness section, and track how well you are moving followers to the next stages.
At the most basic level, your social media analytics platform will show you:
- How well you bring people into your funnel (impressions into follows).
- How much engagement you get (followers/impressions into engagements).
- How many people you turn into traffic (link clicks).
- How much of your traffic converts to your desired goal (UTM tracking).
The possibilities to test, grow and adjust your strategy with those insights alone are endless.
But to get the most out of these metrics — and the ones you will read about later in this article — you need to understand how people are engaged.
To do that, let’s talk about pyramids:
The Engagement Pyramid: Your Ladder To Conversion
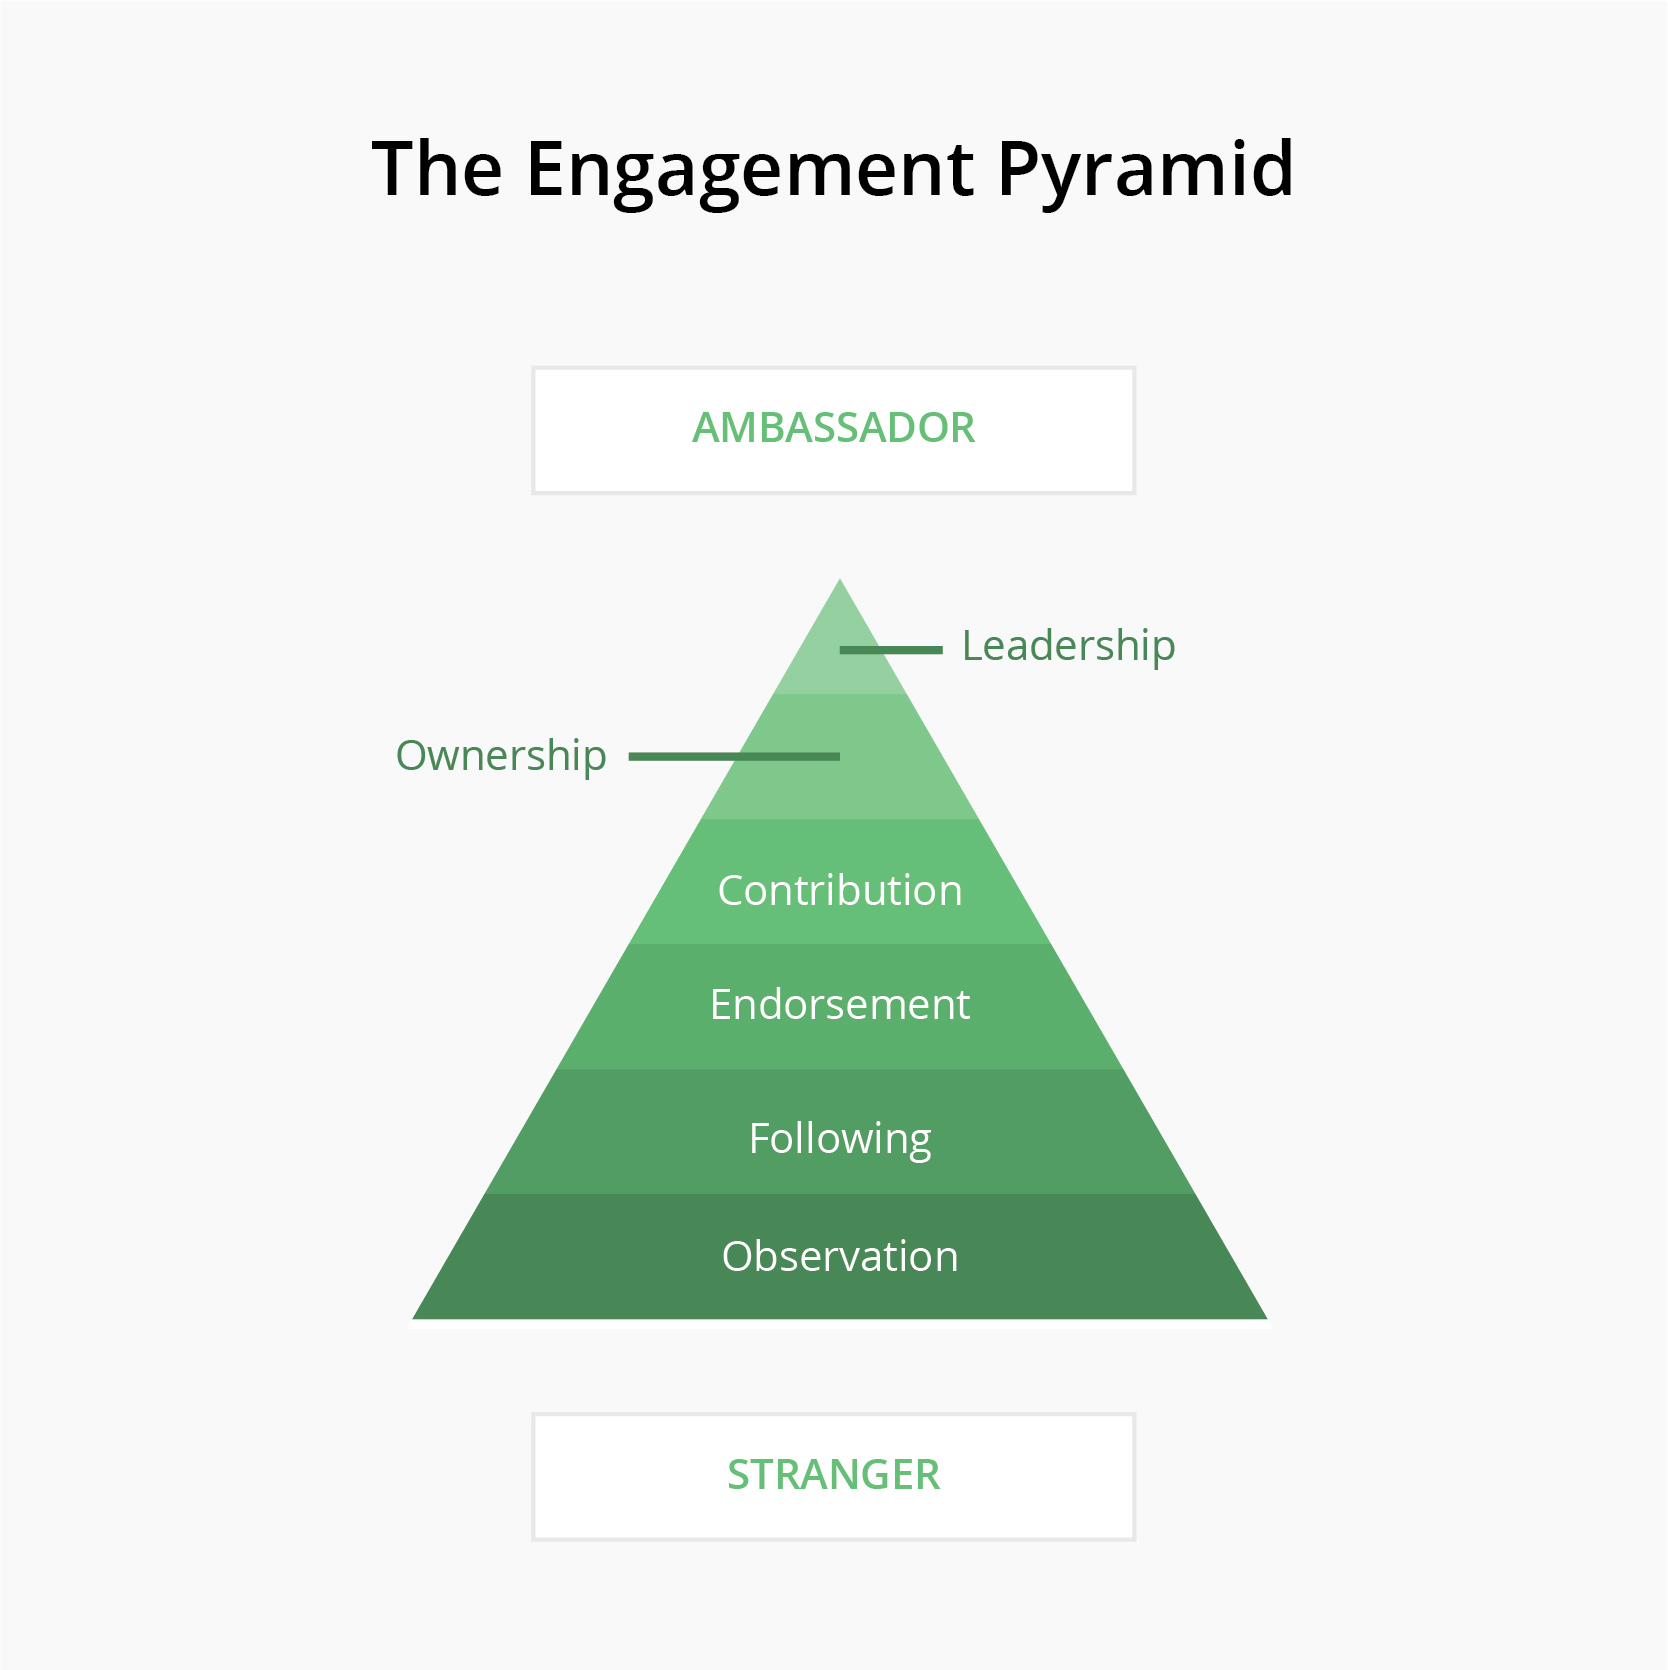
The Engagement Pyramid is the journey a user follows after they become aware of your brand’s online presence.
Think of it a little like a ladder.
The further a user moves up the pyramid, the more engaged and bought-in to your content they become. These people are highly likely to convert and grow your business with word-of-mouth recommendations:
Let’s take a look at how this journey might look for a user.
Sarah (we just made her up) is interested in language learning, and she is about to become aware of your company:
- Observation: Sarah wants to learn French, and a friend tags her in your Facebook update, “Five Fabulous Phrases For Fast French Fluency.”
- Following: Sarah enjoys the post and likes your Page.
- Endorsing: Sarah sees your next post about French food and decides to share it.
- Contributing: Sarah leaves comments on your updates, participates in your live Q&A, and even asks to write a guest blog post.
- Owning: Sarah feels a real affiliation with you and wants to reciprocate. She buys a course.
- Leading: Sarah is impressed. She buys your next product and refers to all of her French learning friends.
Not everybody will reach the upper levels of the pyramid. And, that’s okay. Your job isn’t to get everybody there. It’s to get the right people there.
Your social media statistics can give you the insights to see how much of your audience is at each level. Although you can’t see this on a person-by-person level, you can see the aggregated split in your audience. The more people you’re moving to the top, the better.
Okay, so we have gotten pretty deep into why you need to measure your social media analytics. Let’s start to look at what metrics you need to track.
But first:
How To Approach Social Media Analytics
You will be glad to know you don’t need to be a numbers genius to use social media analytics.

All you need to know is how to run a test and understand the life-cycle of a social media update.
Take a look at the chart below:
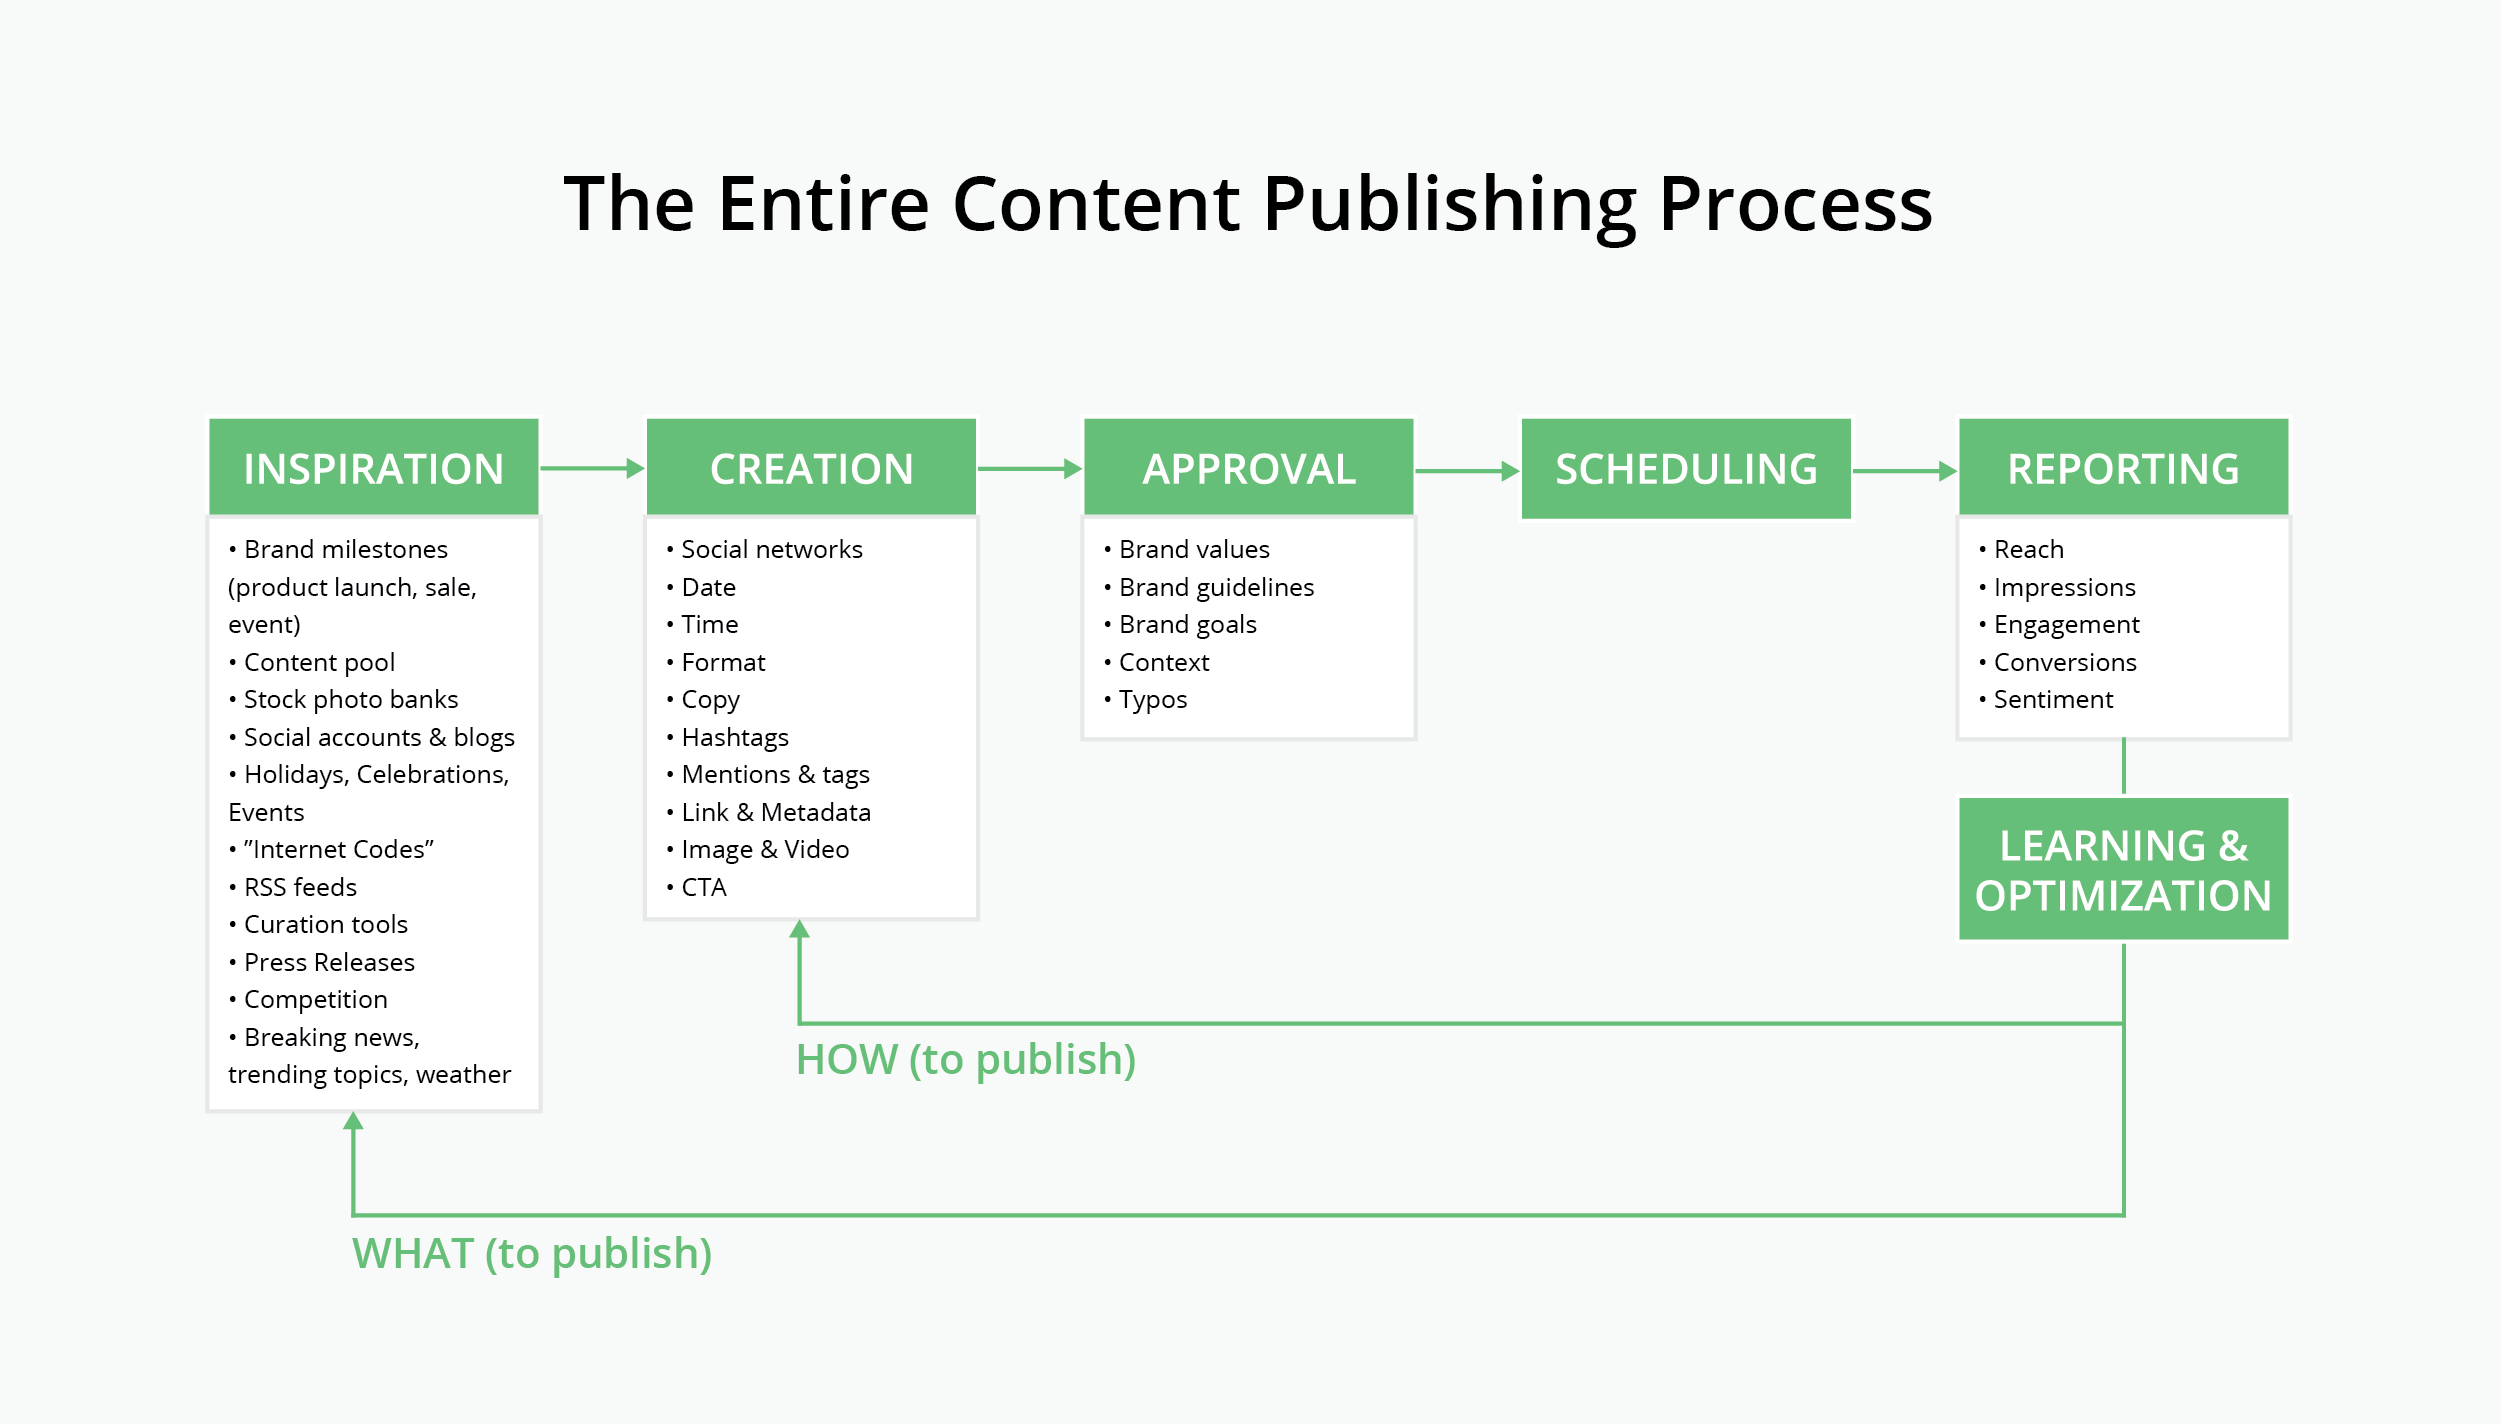
You can see the first steps are about content creation. You get inspiration, create, approve and schedule your posts from your social media calendar.
Analytics comes into play after you have shared, in the reporting, learning and optimization stages.
The data you find here will inform:
- What you publish: the types of content you need to create to engage your audience.
- How you publish: the specifics which make your content, from the date and time, through to the social visuals and specific copywriting you use.
So, your approach is simple:
- Create your updates and share them.
- Use a social media reporting tool to get the data for your key metrics.
- Dig in to find out what caused each of these metrics.
- Use the data to create your next wave of updates.
- Wash, rinse and repeat.
But what metrics do you need to track and on what platforms?
Well, lucky for you, we have got 70 of them for you right here:
The 70 Social Media Metrics You Need To Track
Every social media platform comes with a unique set of metrics.
Why?
Because the psychology of each platform is different. When you’re scrolling Facebook profiles, you’re in a different mindset to when you are on Pinterest, and LinkedIn comes with a different intent to Quora.
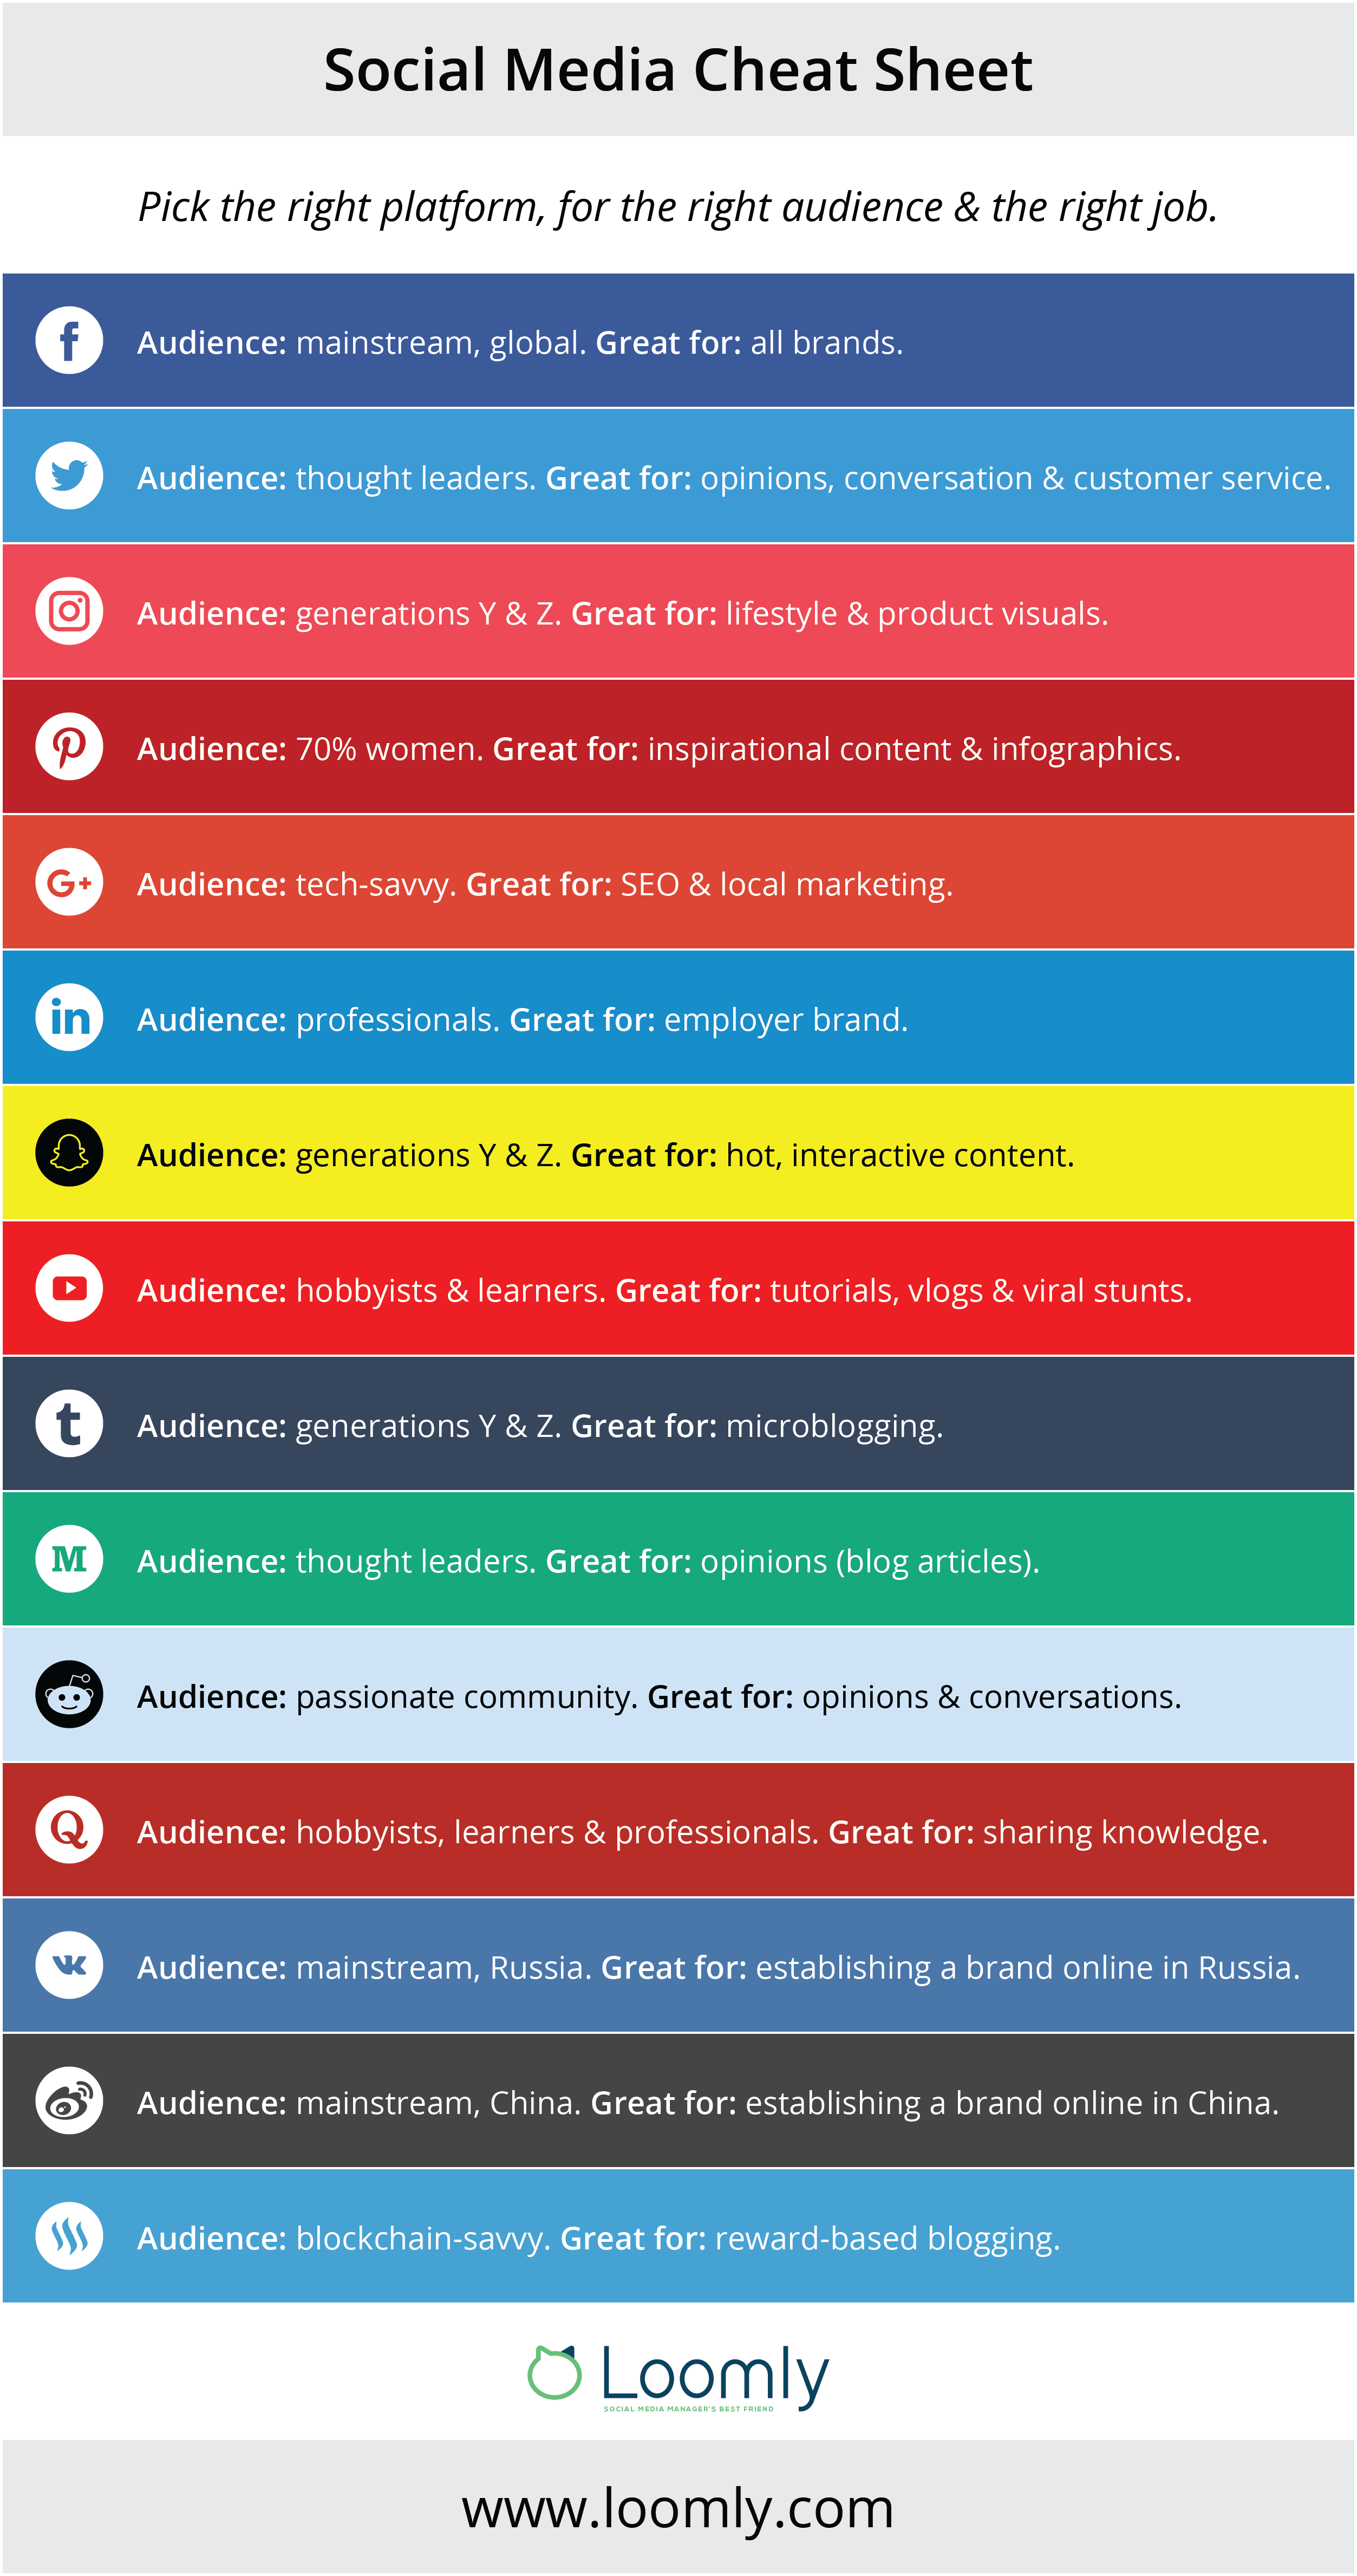
Here is a quick, simple cheat sheet summarizing each social media platform’s unique value proposition and what to take advantage of it for:
Knowing what metrics you need to measure is essential to developing a profitable content strategy.
After all, each business has different needs: a furniture upcycling side-hustle has many different needs to a viral news site, and the metrics they need to track will be different (Reviews vs. Shares).
In this section, we are going to break down each of the metrics and help you decide for yourself which metrics you will need to pay attention to.
They’ll all be broken down into one of these three categories:
- Post-level metrics: measuring the performance of each post you share.
- Account-level metrics: measuring how people interact with your account (or social media page).
- Link-level metrics: measuring the performance of a link you share on your page.
Let’s dive into them, shall we?
Facebook’s focus for the foreseeable future is on “meaningful communities.” Friends, families, and groups are seeing increased organic reach, while marketing efforts are seeing a decline in reach. But don’t let that stop you. By understanding Facebook’s many metrics, you can create a strategy and build a business-changing community there.
Here’s what you need to know:
- Post-Level Metrics
You can view this metric on a post-by-post level:
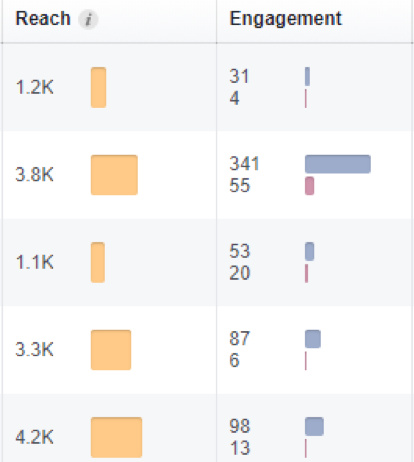
Which will show you the types of content with the best (or worst) reach.
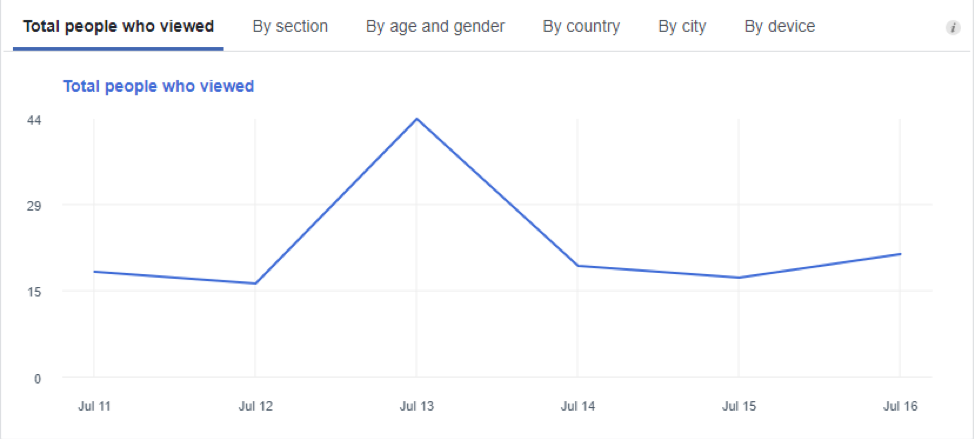
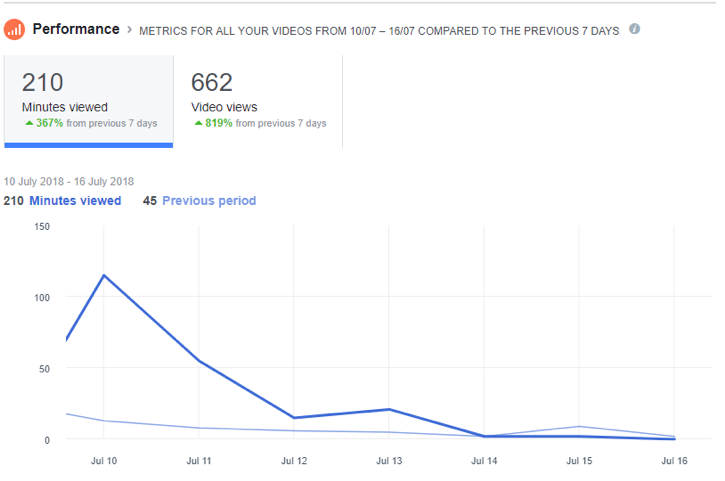
But you can also see this over a broader period to see the reach of all of your posts, and how it fluctuates:
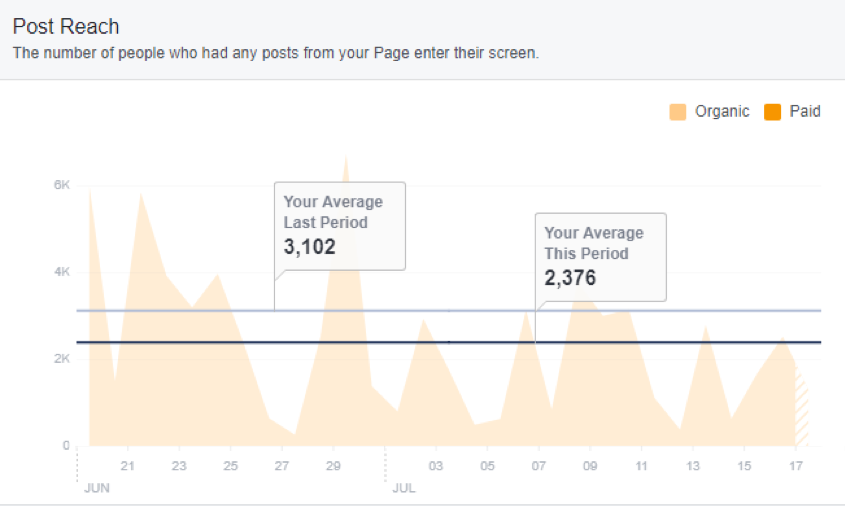
These metrics give you an insight into the overall potential reach and growth of your audience. But, on Facebook, this can also show what types of content get more reach than others.
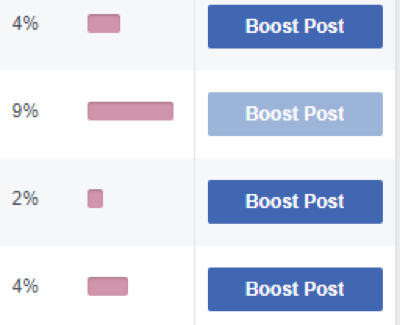
Post engagement will usually be between 2% and 12% of the total number of people who actually saw your post, with a higher number being a clear indication of posting high-quality content at the right time.
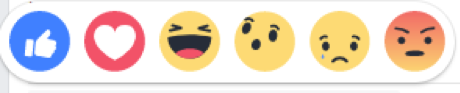
Facebook reactions allow you to track your audience’s sentiment towards your content. You can also use the combined number to see your reach and engagement and to inform your content analysis.
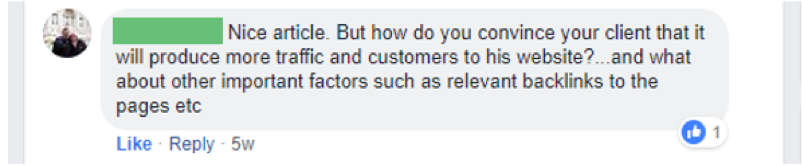
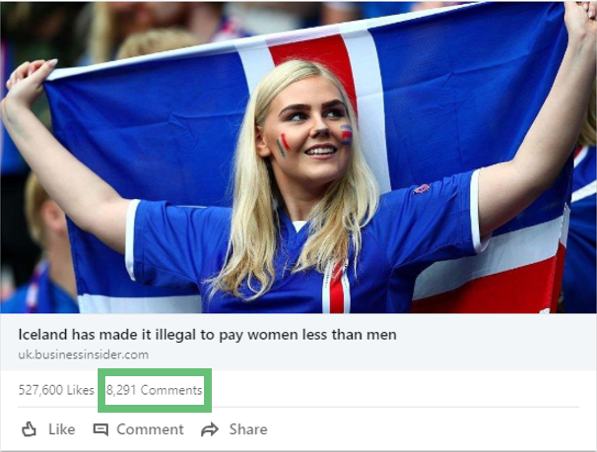
Comments help you to gauge your community responsiveness and their overall sentiment.
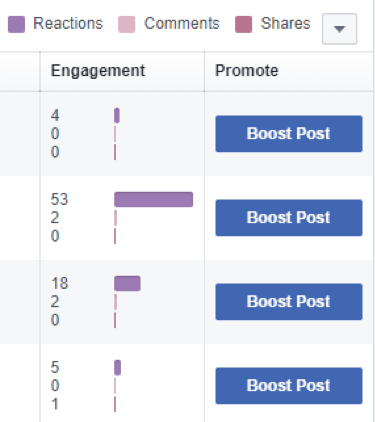
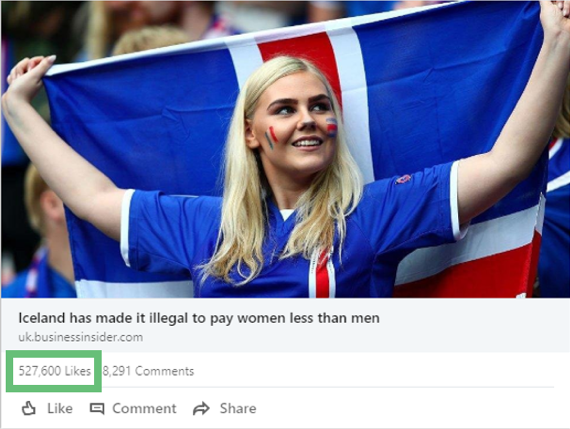
Shares are a measure of how “viral” your post is.
A high number of shares is great if you’re looking to generate traffic.
But they don’t always tell the whole story, and one share to the right person can be worth 1,000 shares to the wrong people.
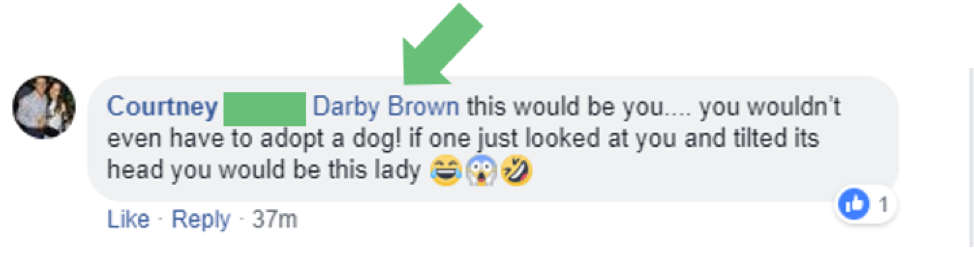
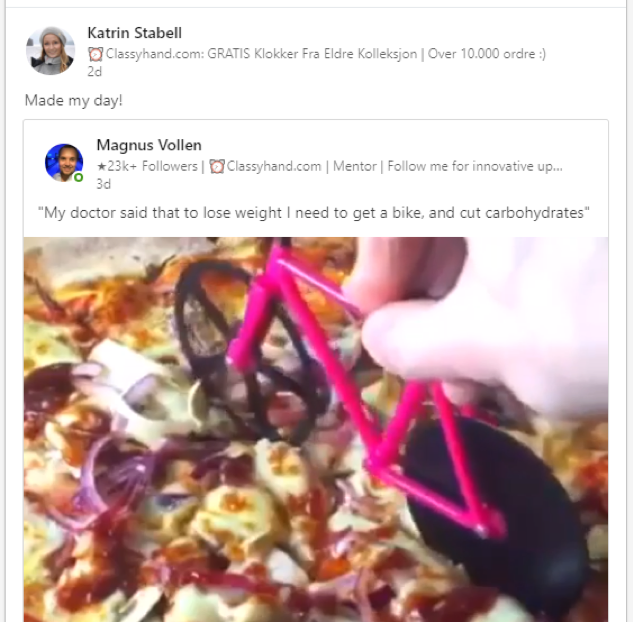
You should also be aware of “tagged” comments, where users place a name in your comments box:
Shares are a high-level endorsement and can be used to track:
- Traffic
- Responsiveness
- Reach
- Engagement.
If shareable content is your goal, they can also play a hand in content analysis.
- Account-level metrics
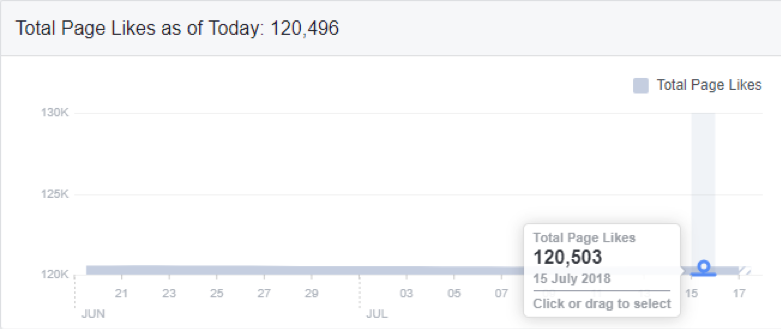
You can use fluctuations in likes to measure your growth and the performance of your content.
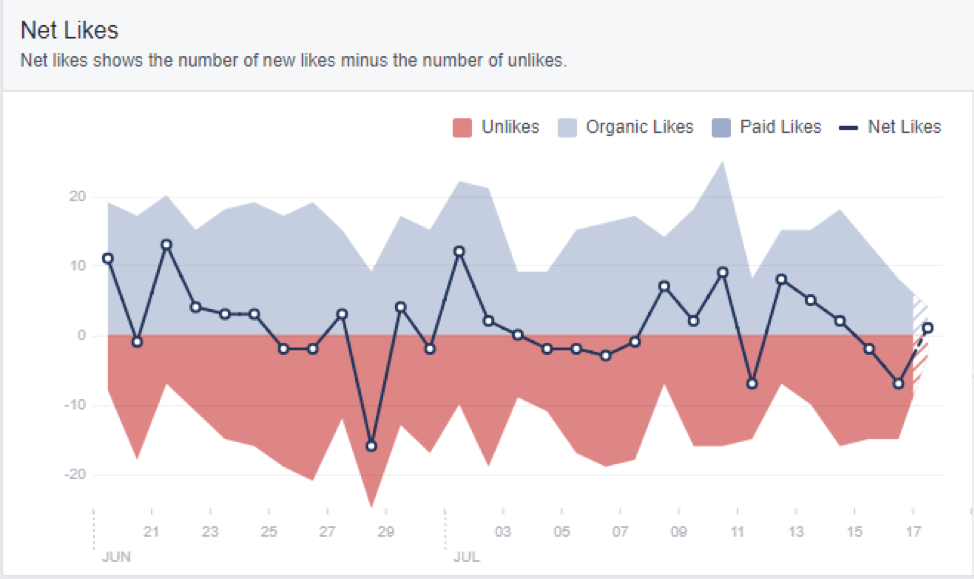
It’s also worth tracking your daily net likes (the combination of likes and unlikes together) to see a true response to your content:
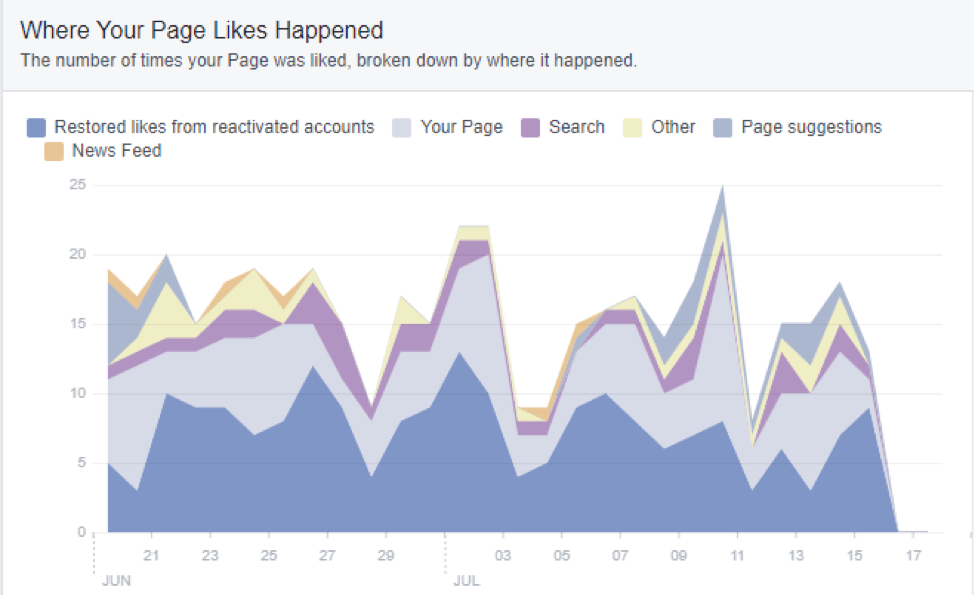
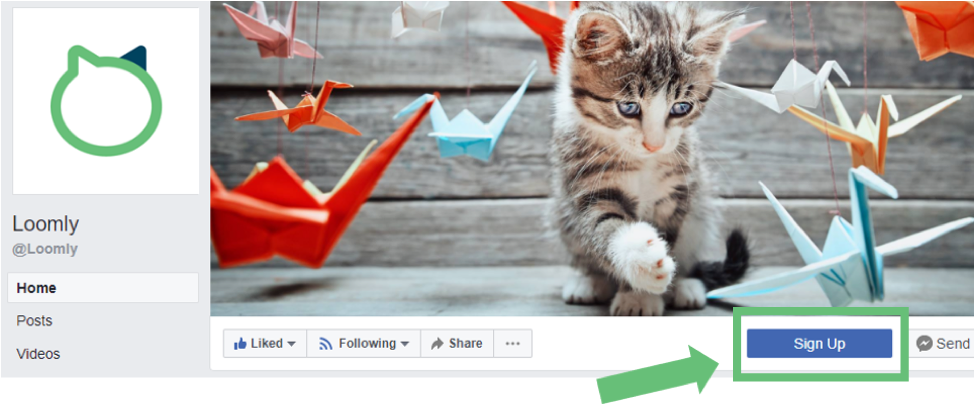
You can also see where your page likes happened to determine the most effective methods of gathering new fans:
Likes are a direct measurement of audience growth.
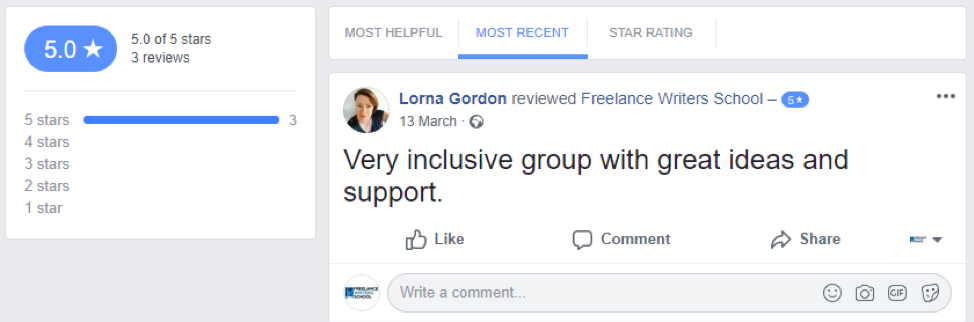
These can help indicate community responsiveness and work as a competitive benchmark with other active profiles in your industry.
This metric shows traffic to your page and can help you see how well you convert to the following stage of your engagement pyramid.
 This can help you determine the quality of traffic to your page.
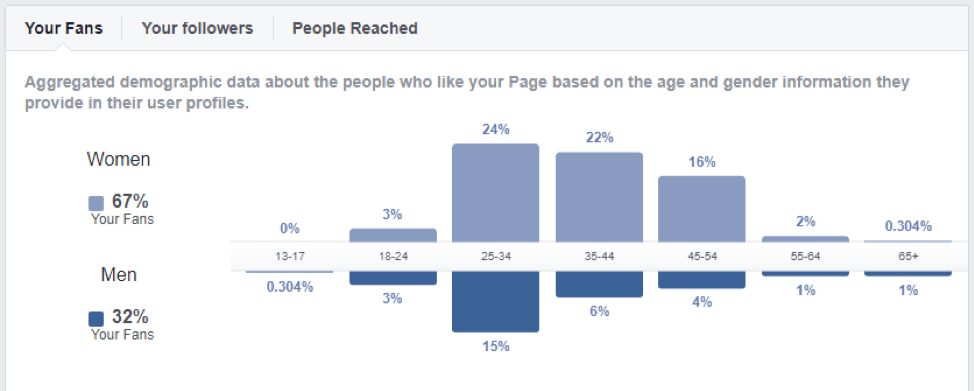
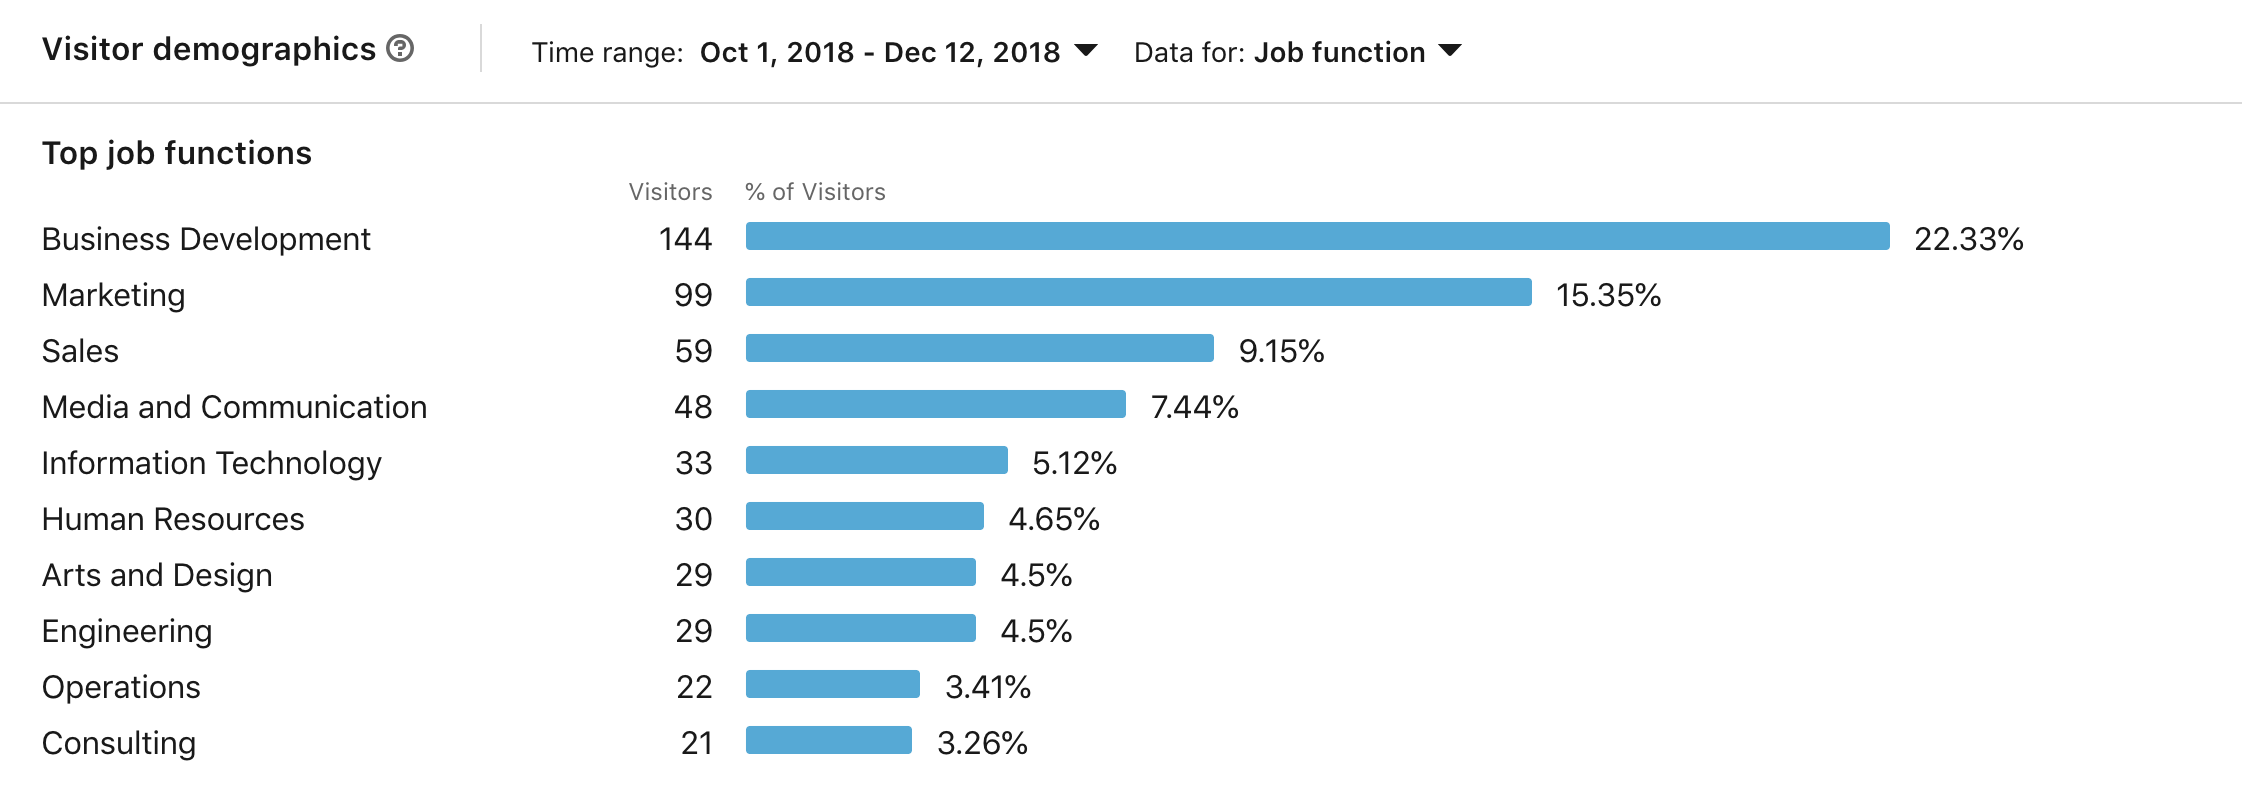
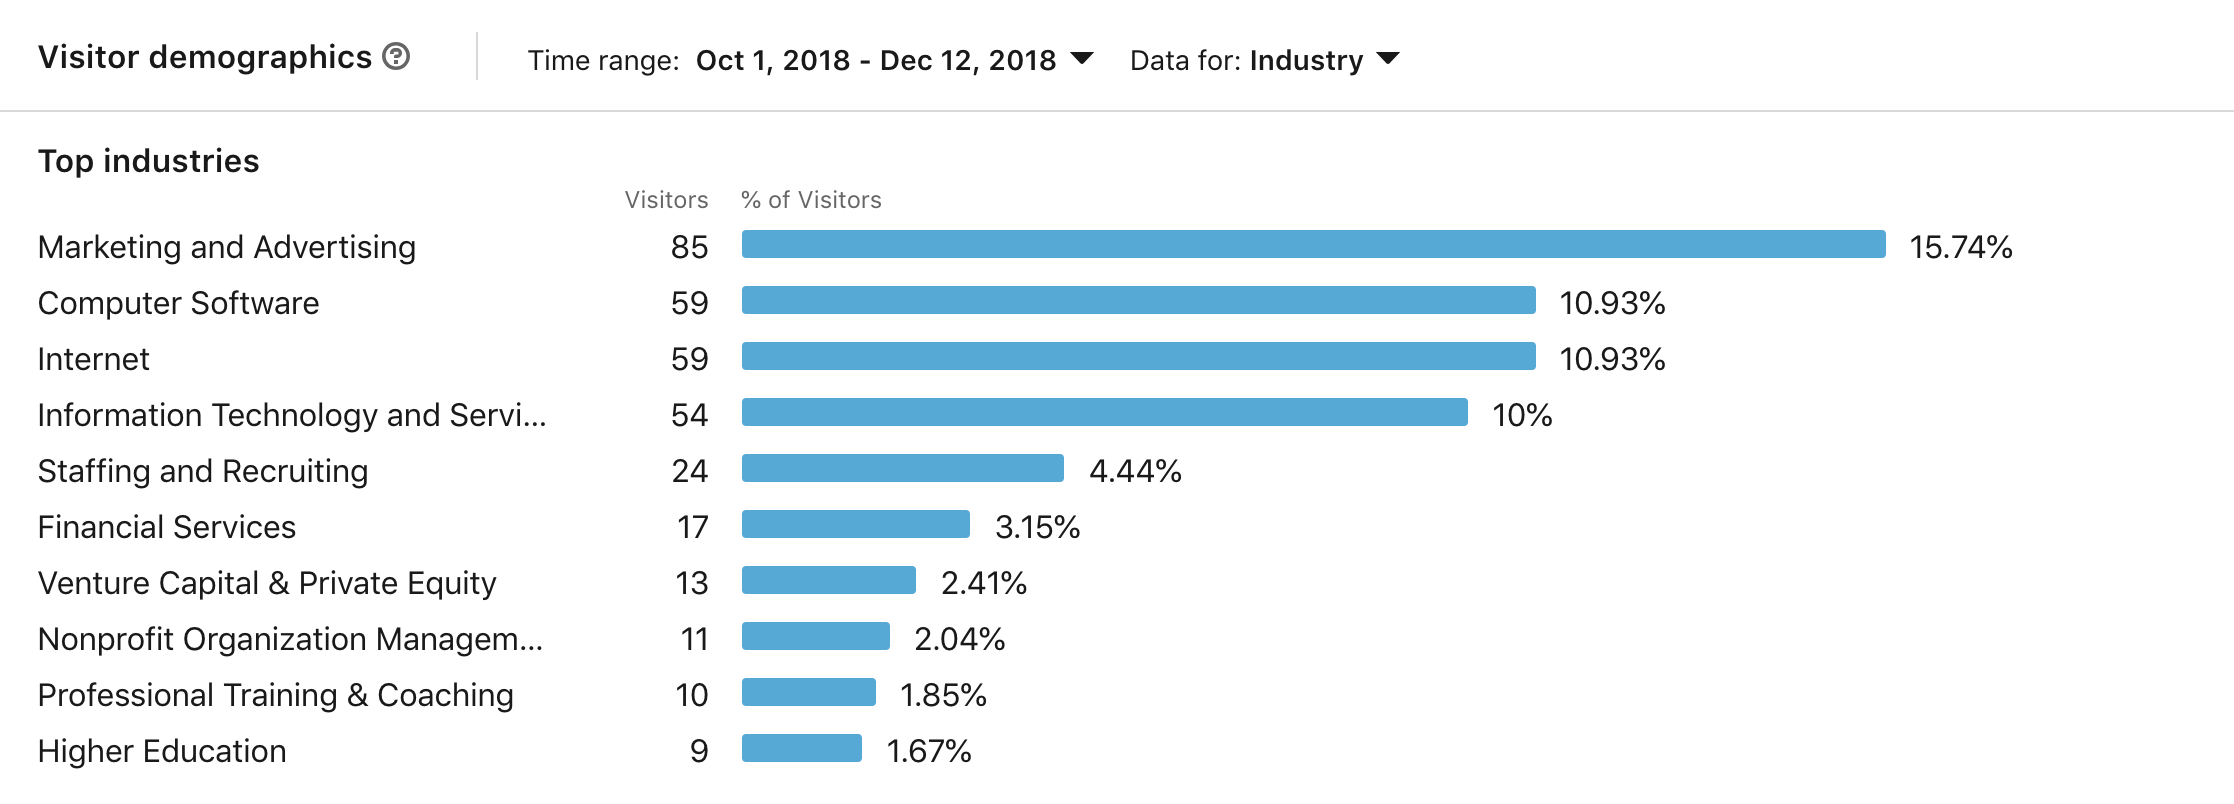
The metrics here allow you to understand your audience profile, and track whether you’re attracting the right people with your content.
This is best benchmarked against your past performance or that of your competitors.
You’re also able to see the breakdown of your demographics, as you saw in the people metrics section above.
- Link-Level Metrics
Usually tracked in Google Analytics with a UTM tracking code.
This can only be measured from link-based posts and should be measured alongside reach and engagement to gauge performance.
a
Despite a slightly slowing growth in recent years, Twitter remains the best place to connect with your audience one-on-one and remains a giant social media platform with an incredibly loyal fan base.
Here are the metrics you need to measure on Twitter:
- Post-Level Metrics
High impressions could be valuable even if your tweet had a low engagement rate, as constantly being seen can be great for brand awareness.
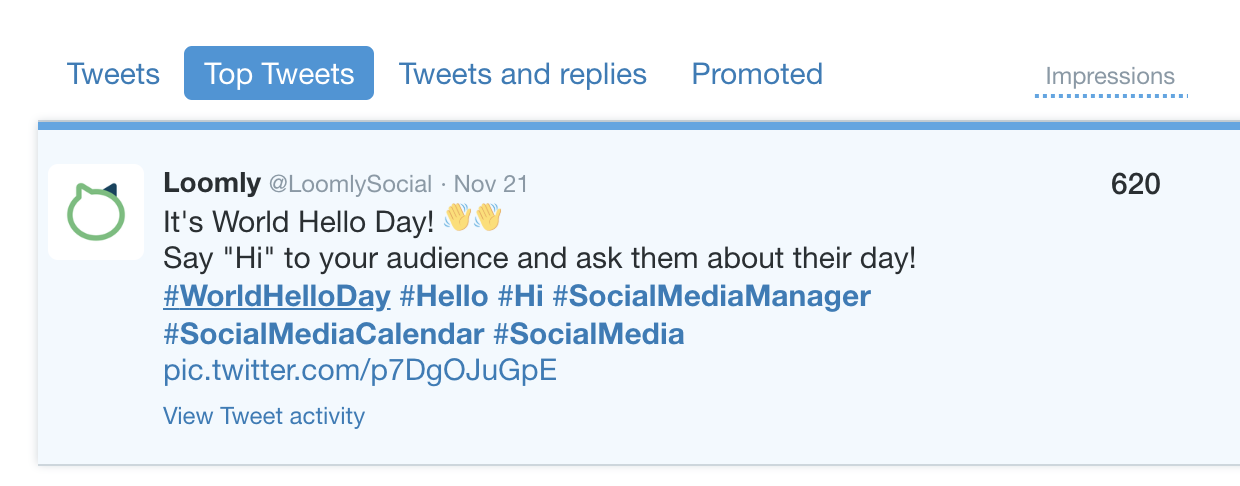
You can also view the impressions of your tweets over time:
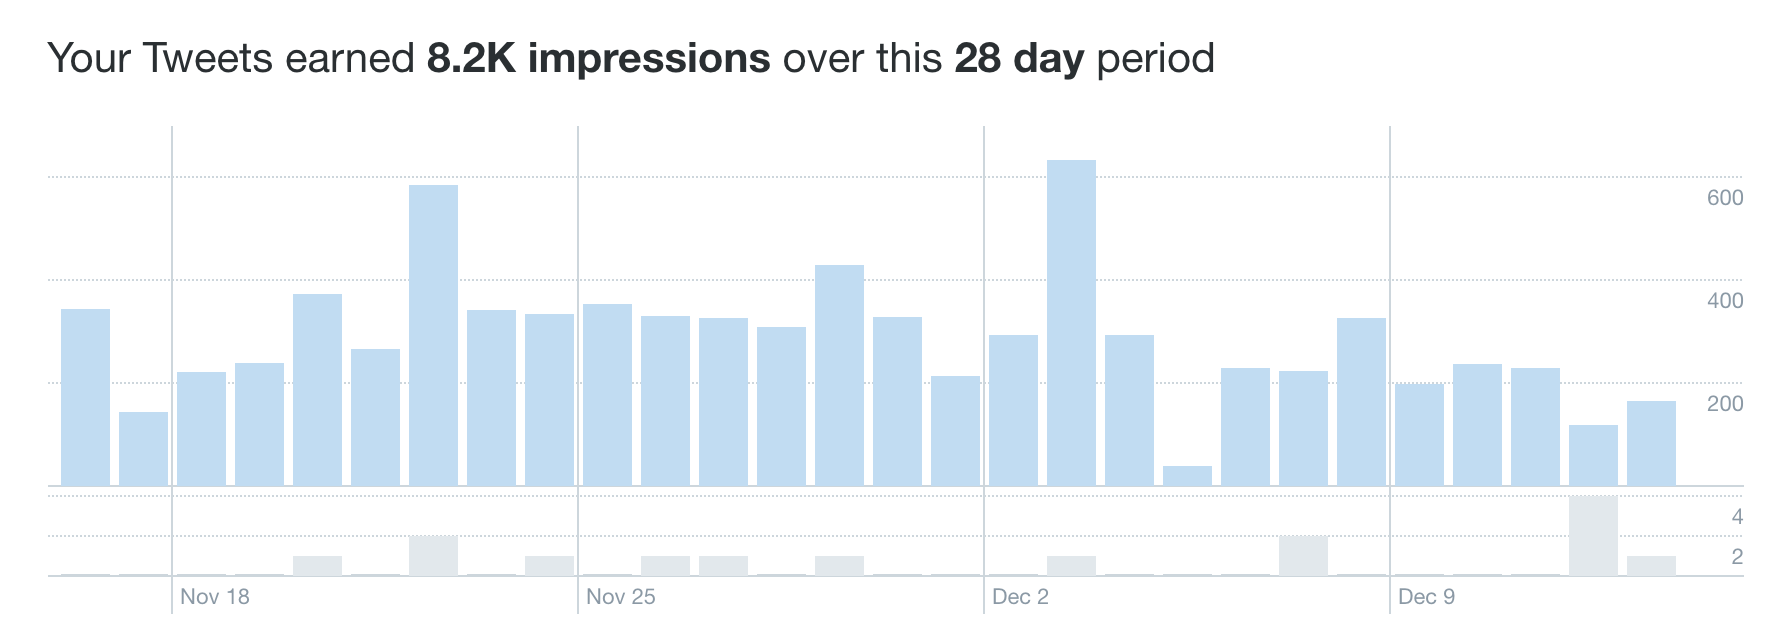
This combination can help inform decisions about how you publish and optimize around when your audience is online.
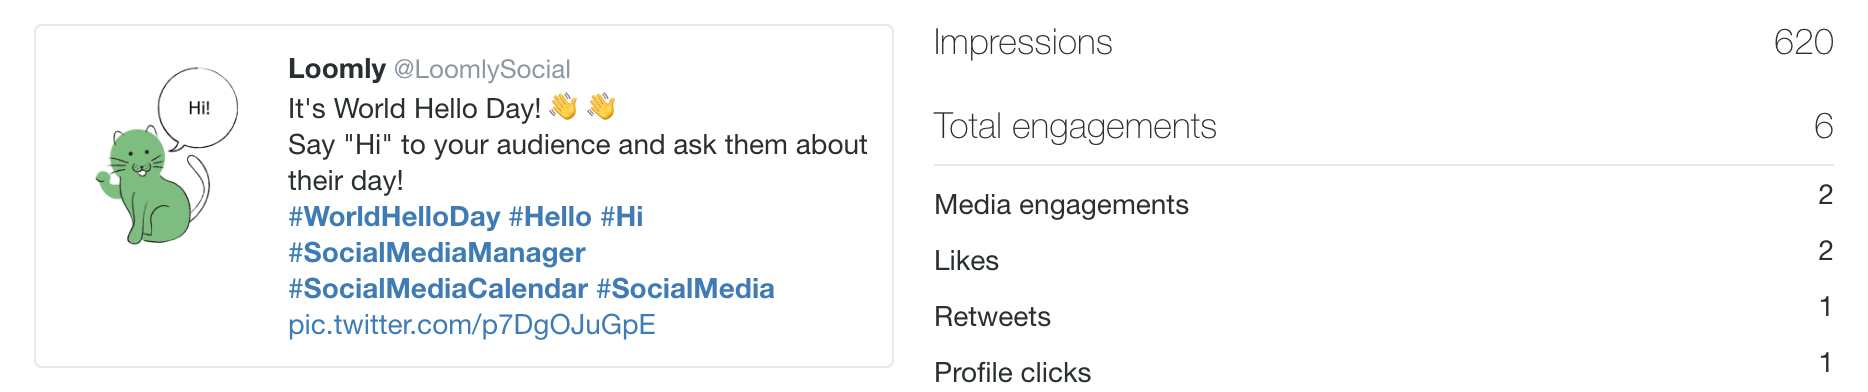
A direct marker of audience engagement that should inform your content analysis.
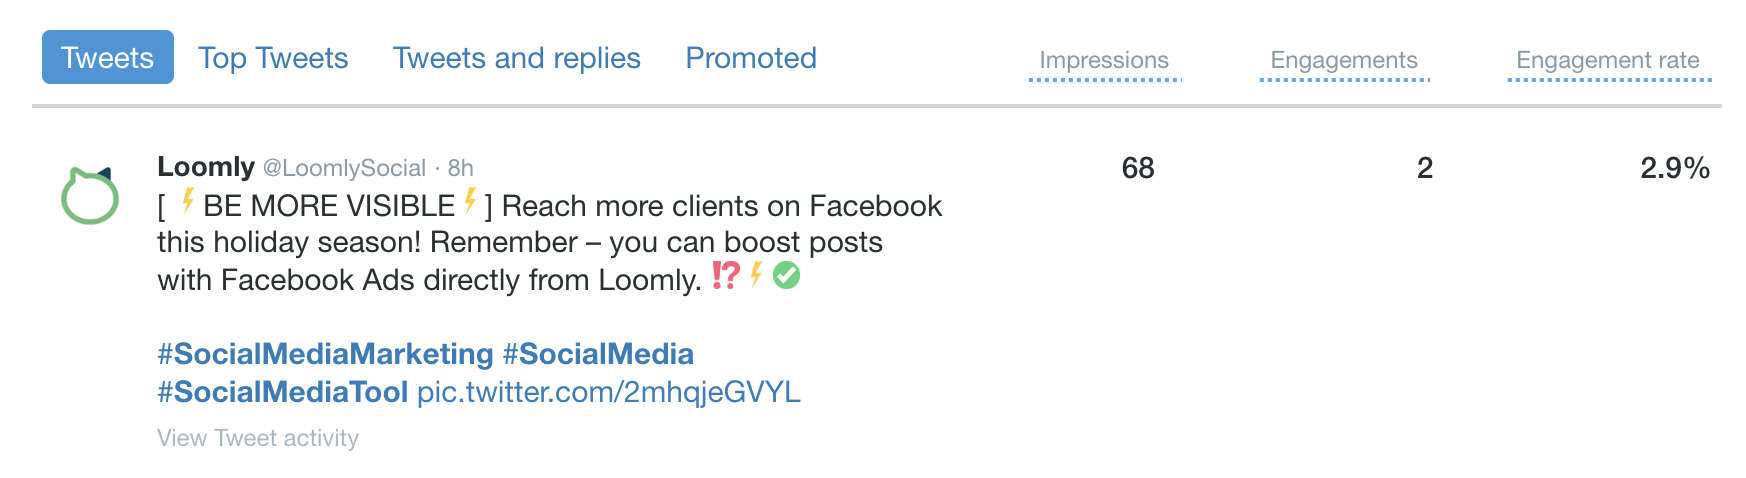
This metric is dependent on your audience. If lots of people see your tweet, but few engagements happen, it could be a sign of low-quality content. Of course, the opposite is also true.

Retweets should play a large role in your content analysis and can be a measuring stick of the responsiveness of your content.
The more likes, the better. Use this to influence your future content decisions.

Twitter users want conversation so high numbers are a positive metric. Can also be used to analyze audience sentiment.
- Account-Level Metrics
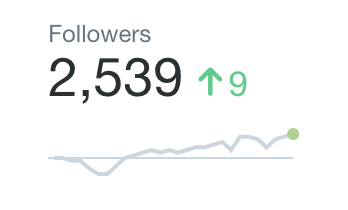
This metric marks the growth of your page. As you may imagine, generally, the more followers, the better, as long as those followers are real, humans and engaged.
Be aware of Twitter bots and explicit pages who randomly follow pages and remove them from your follower count regularly. They can affect your audience insights and give you a false picture of how many people you’re reaching.
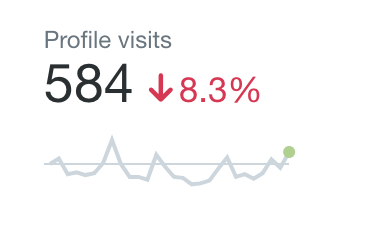
Visits show direct traffic to your profile, as well as the potential reach and growth of your account. The more views, the more people are looking at your brand.
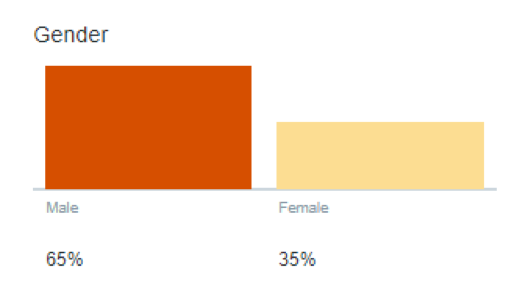
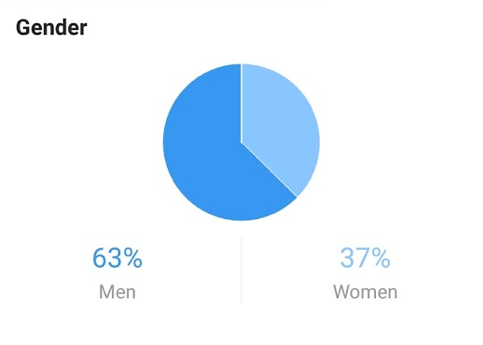
The gender of your followers can influence the tone and style of content:
While their interests can help you adjust your strategy to focus on their most-tweeted-about themes:
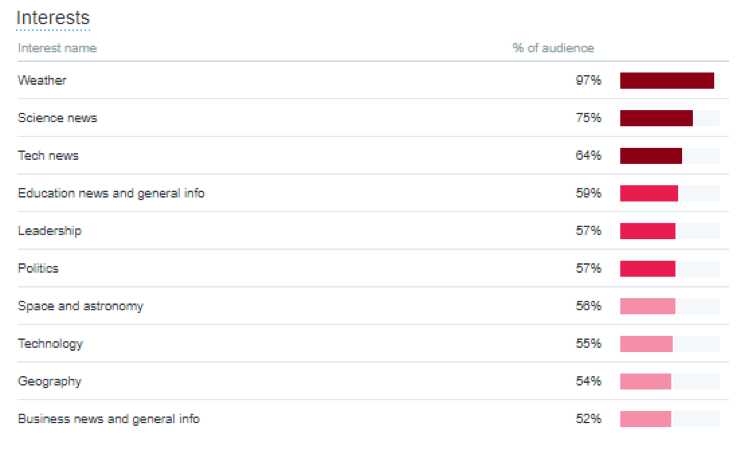
Although Oscar Wilde would probably frown upon tweeting about the weather.
- Link-Level Metrics
This metric should be used in comparison with impressions and engagement to indicate how well your tweets are converting into traffic.
“If content is king, then conversion is queen.”
– John Munsell (@JohnMunsell)
Instagram is a powerhouse right now.
They’re constantly innovating new products, like IGTV, and tend to crush their competitors. Like when the launch of Stories reportedly resulted in Snapchat’s growth slowing down by 82%!
If you have a visual or video based brand, you need to be sharing on Instagram.
To access your insights in-app, you’ll need to create a business account.
When you do, here’s what to measure.
- Post-Level Metrics
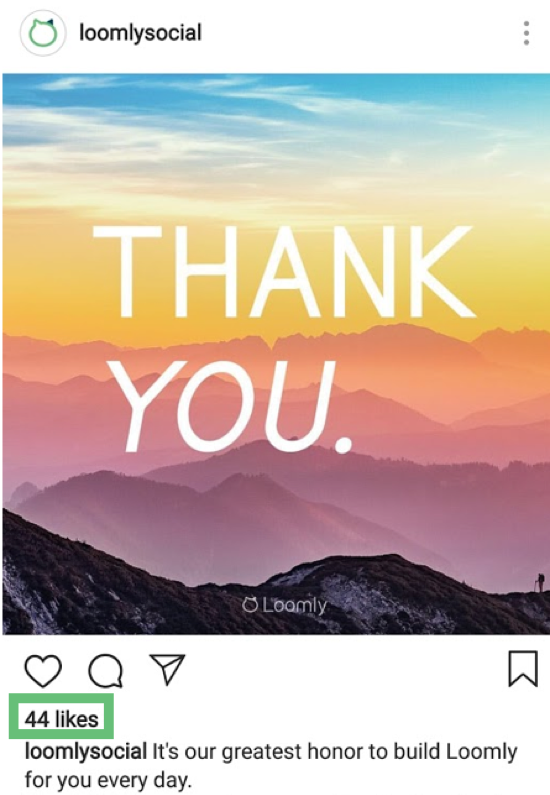
Likes can increase your profile’s discoverability, so check to see how many new sources you’re receiving likes from. The more of these you get, the further your content will reach.
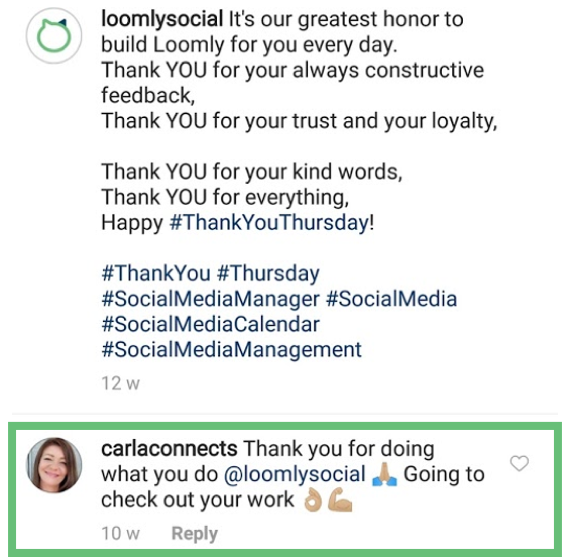
Instagram values comments and they have the potential to increase reach. But it’s best to use this metric to measure how engaging your content is.
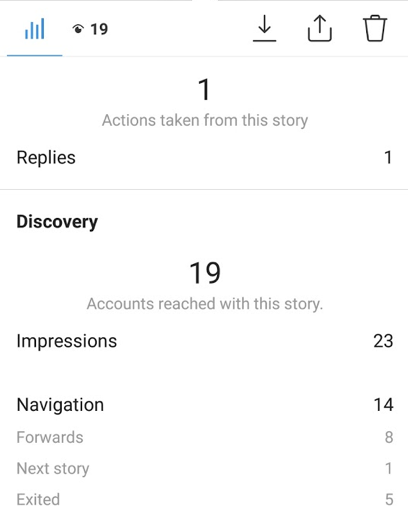
Being able to see how long people watched for, and who swiped onwards, can inform your content decisions and work towards more engaging stories.
- Account-Level Metrics
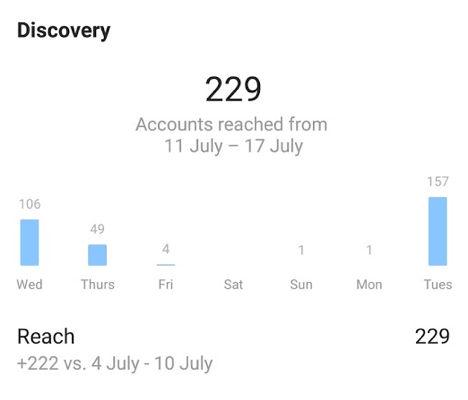
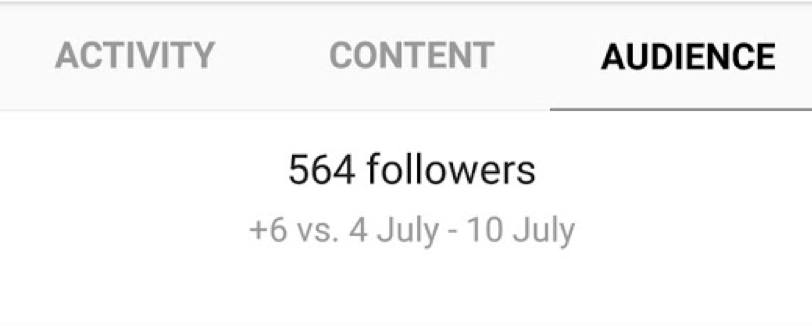
This is a clear sign of growth and reach on the platform. You want this number to go up!
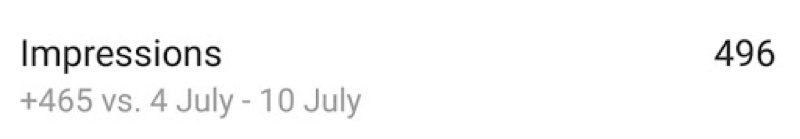
Impressions have value even with low engagement. When people are at the “observation” stage of engagement, they often need to see your content multiple times before interacting.
Use this to measure the growth of your page. It could also be used to see the results of a specific hashtag on overall growth.
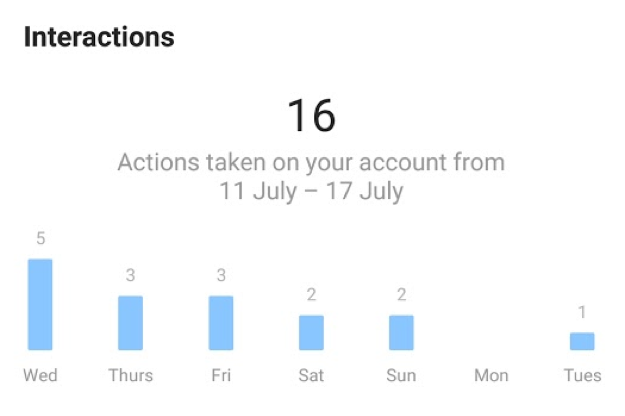
Allows you to directly see which posts (or series of) on a particular day lead to high activity.
A clear indication of the visibility of your platform in discovery and follower’s news feeds.
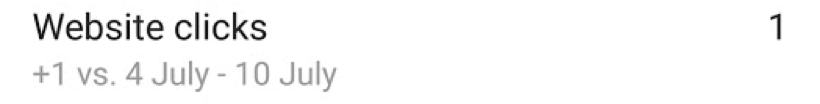
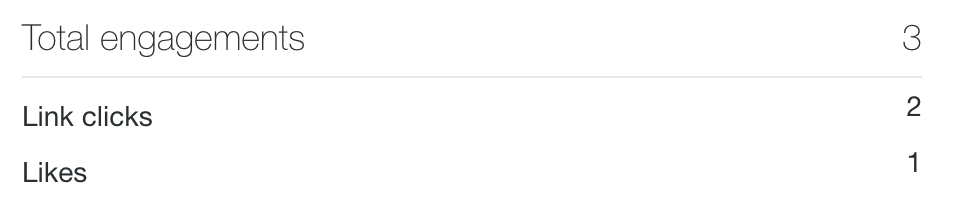
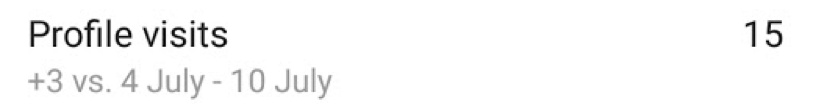
This metric can help you to optimize your profile copywriting, as well as test call to actions and clickability of different types of content.
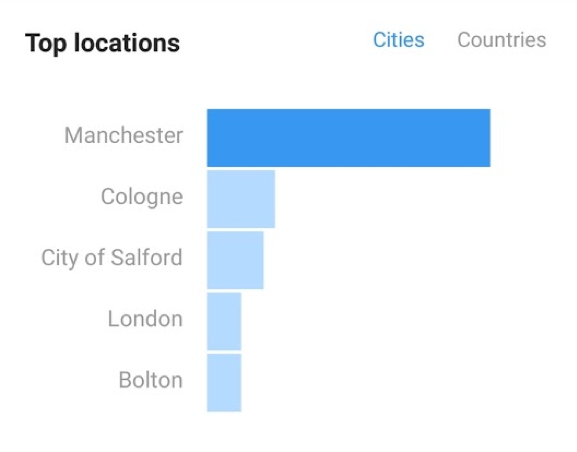
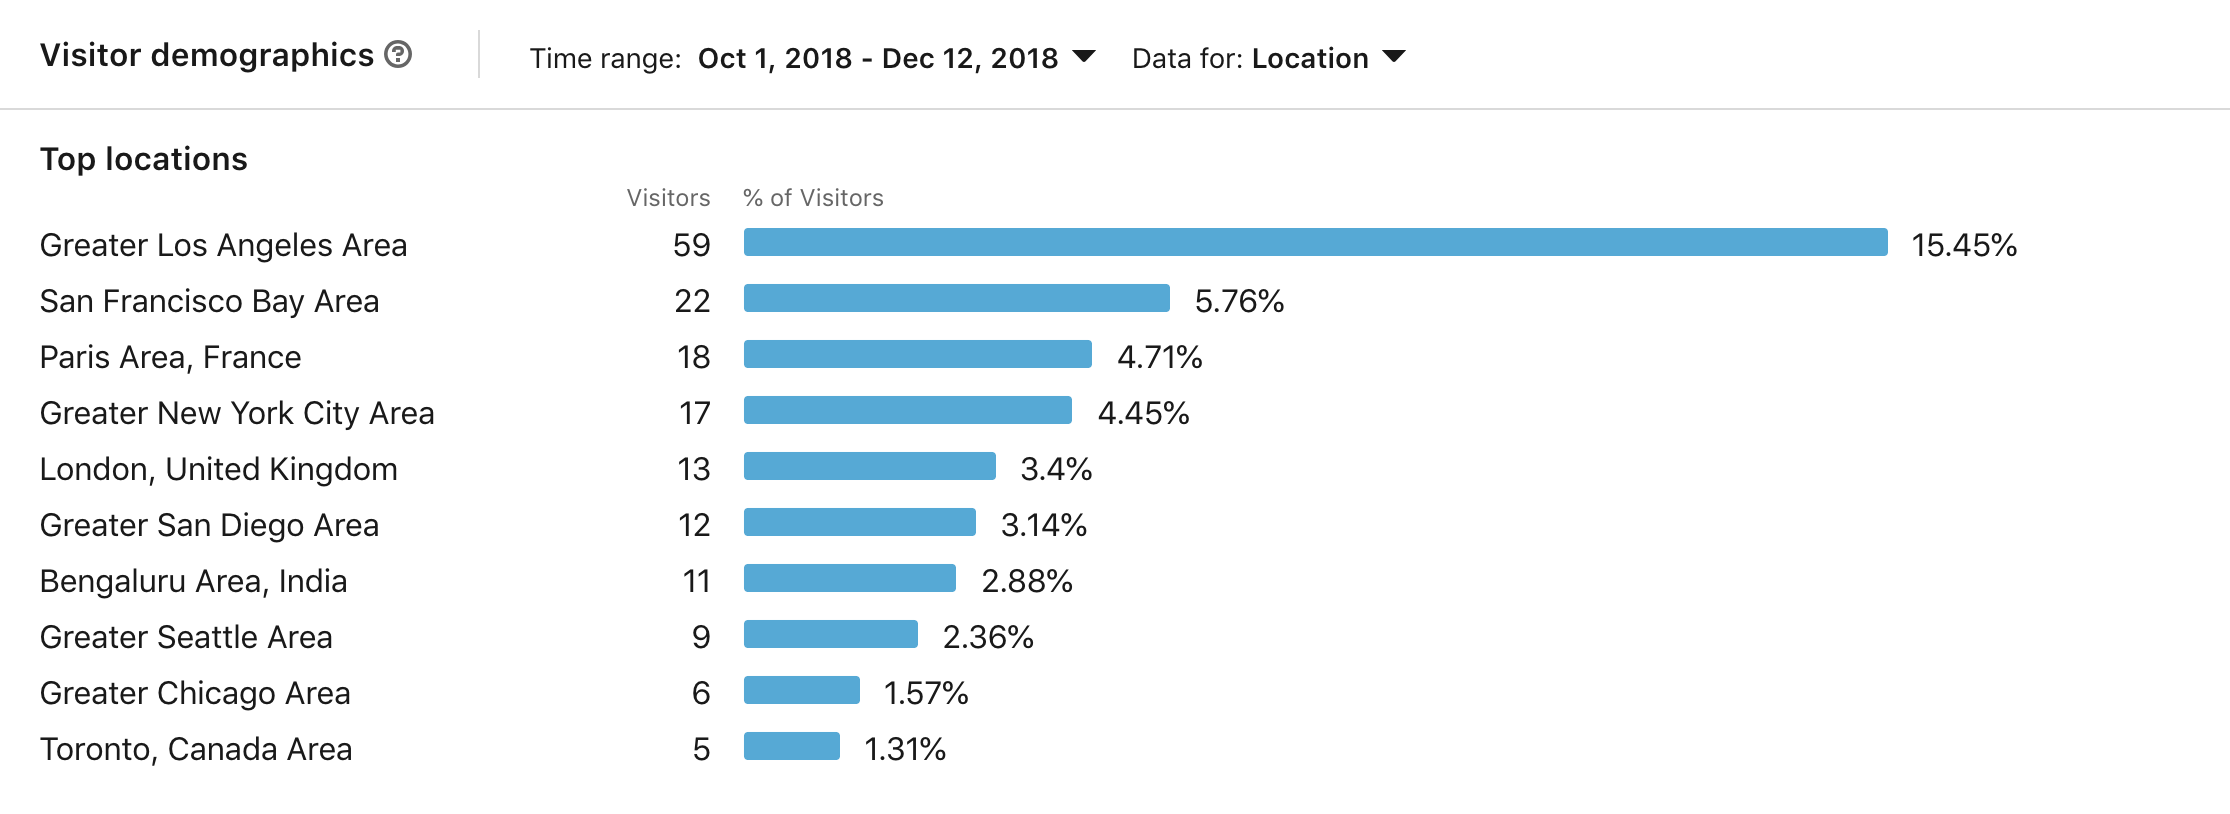
You’re able to see your followers’ locations:
Their age ranges (also broken down by gender):
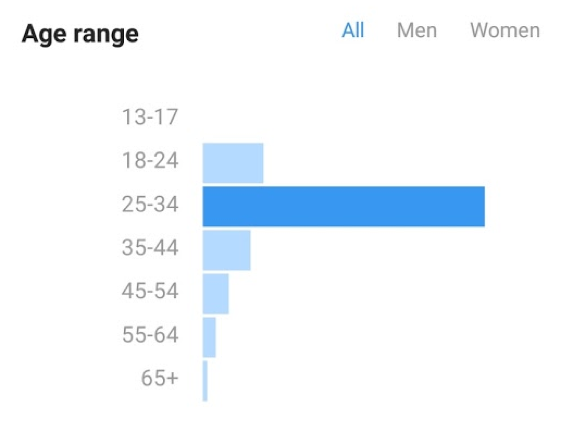
The gender split:
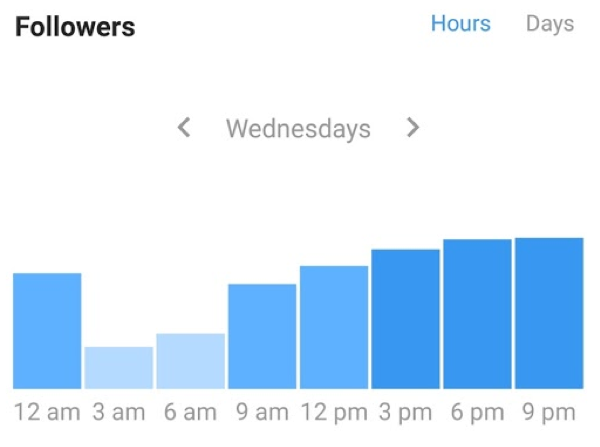
And their most active hours on the platform (even on a day-by-day breakdown):
Your business model will dictate how you interpret these metrics.
If you’re a local bakery, you’ll probably be looking for local people in a certain age range. But if you’re a SaaS company, the location will be less important, and gender may play a larger role.
But with the most active hours, you can plan your updates for maximum visibility.
Pinterest is one of the most buyer-lead social media platforms right now and recently, the platform also reported getting close to $1B in ad sales.
92% of Pinners have used it to plan or make purchases, while 52% have seen a product shared and made a purchase: if you’re looking to convert social media users into buyers, you need to be sharing content here.
Here are the key metrics to track.
- Post-Level Metrics

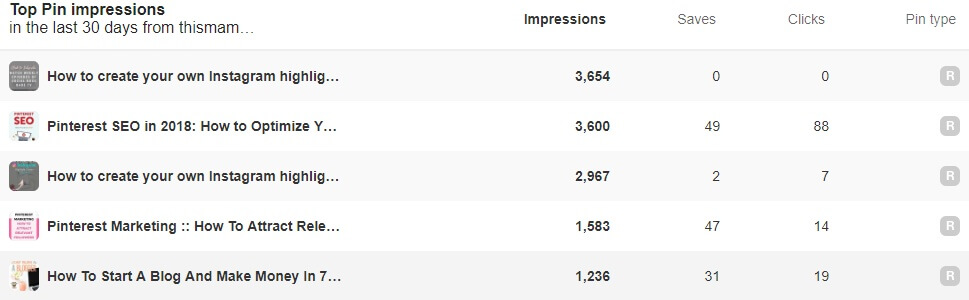
This is a clear indicator of high-quality content because users want to return to this content and not lose it.

The qualitative feedback you can use to inform your future content strategy and audit audience sentiment.
- Account-Level Metrics
An indicator of the organic reach your pins are getting.
- Link-Level Metrics
Source: https://www.persuasion-nation.com/blog/pinterest-seo-best-practices-step-by-step-guide-2017-edition
Allows you to see how well you convert overall impressions into website traffic.
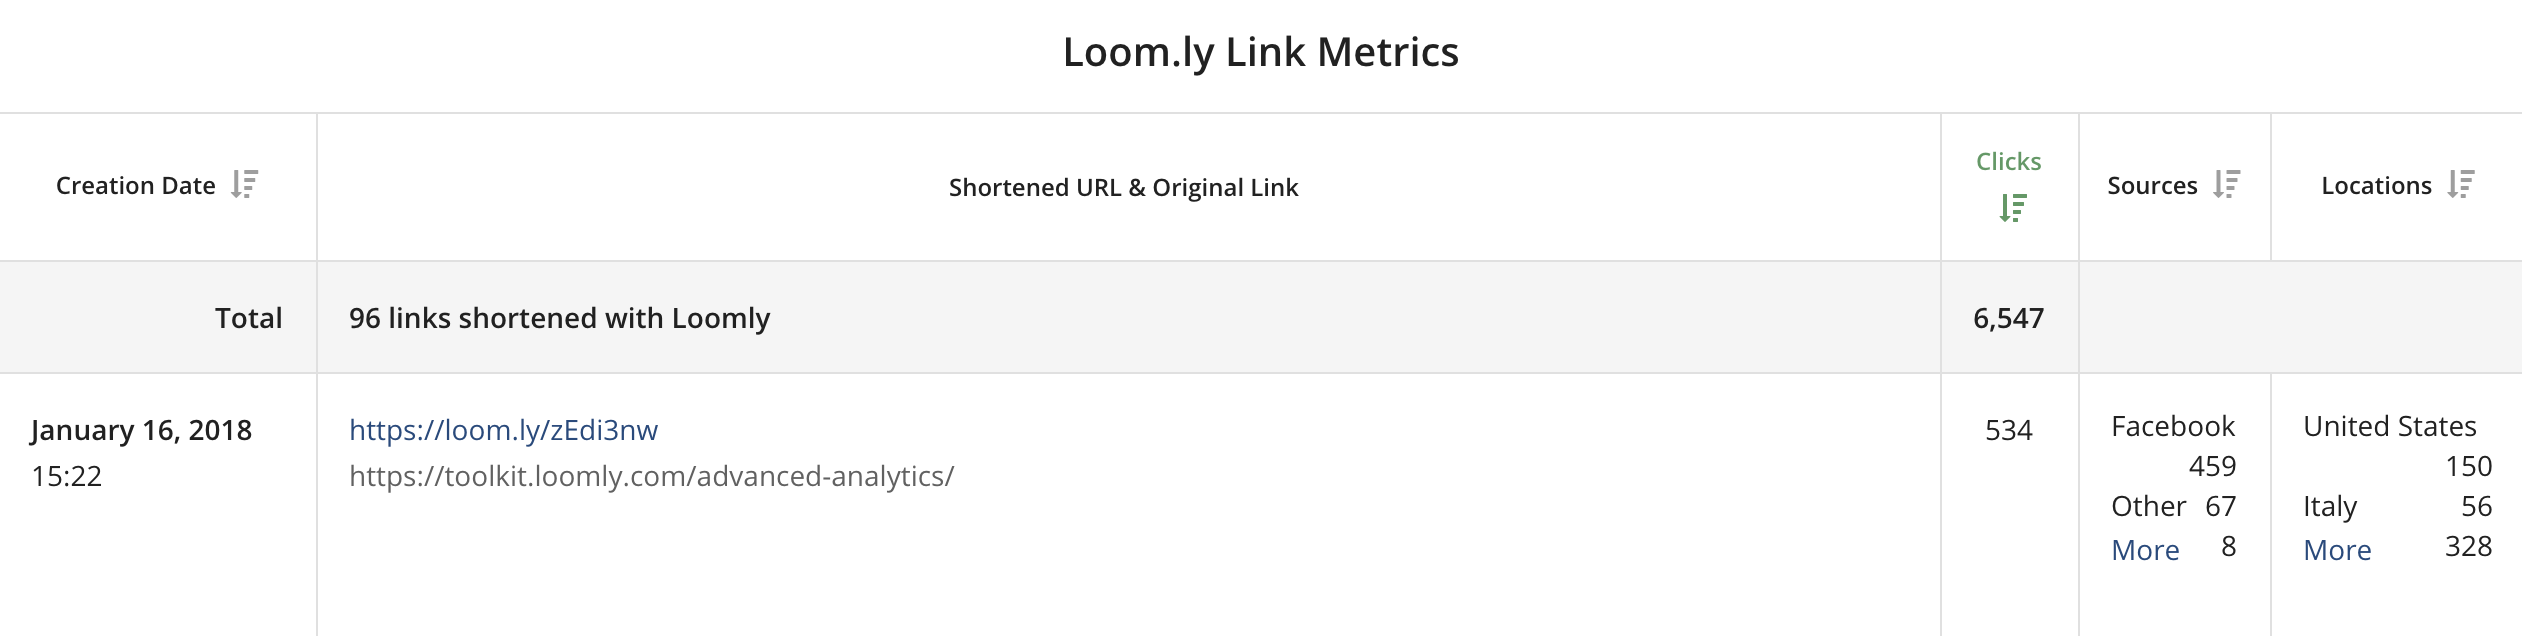
Best tracked using a Google Analytics UTM code or a URL shortener, as we offer inside the Loomly tool.
LinkedIn is the platform if you want to connect with business and career-oriented individuals.
With over 260 million users, there’s a lot of potentials to find the right audience here.
These are the metrics you need to know about.
- Post-Level Metrics
Likes can drastically improve the organic reach of your updates, so the more of them you get, the better you’ll perform.
More comments mean your content is engaging and are a clear indicator of your community’s responsiveness. They can also be used to inform future content decisions.
More shares result in more reach and engagement, as well as increase your overall website traffic (if it’s a link-based post).
- Account-Level Metrics
Use this metric to track audience growth and size.
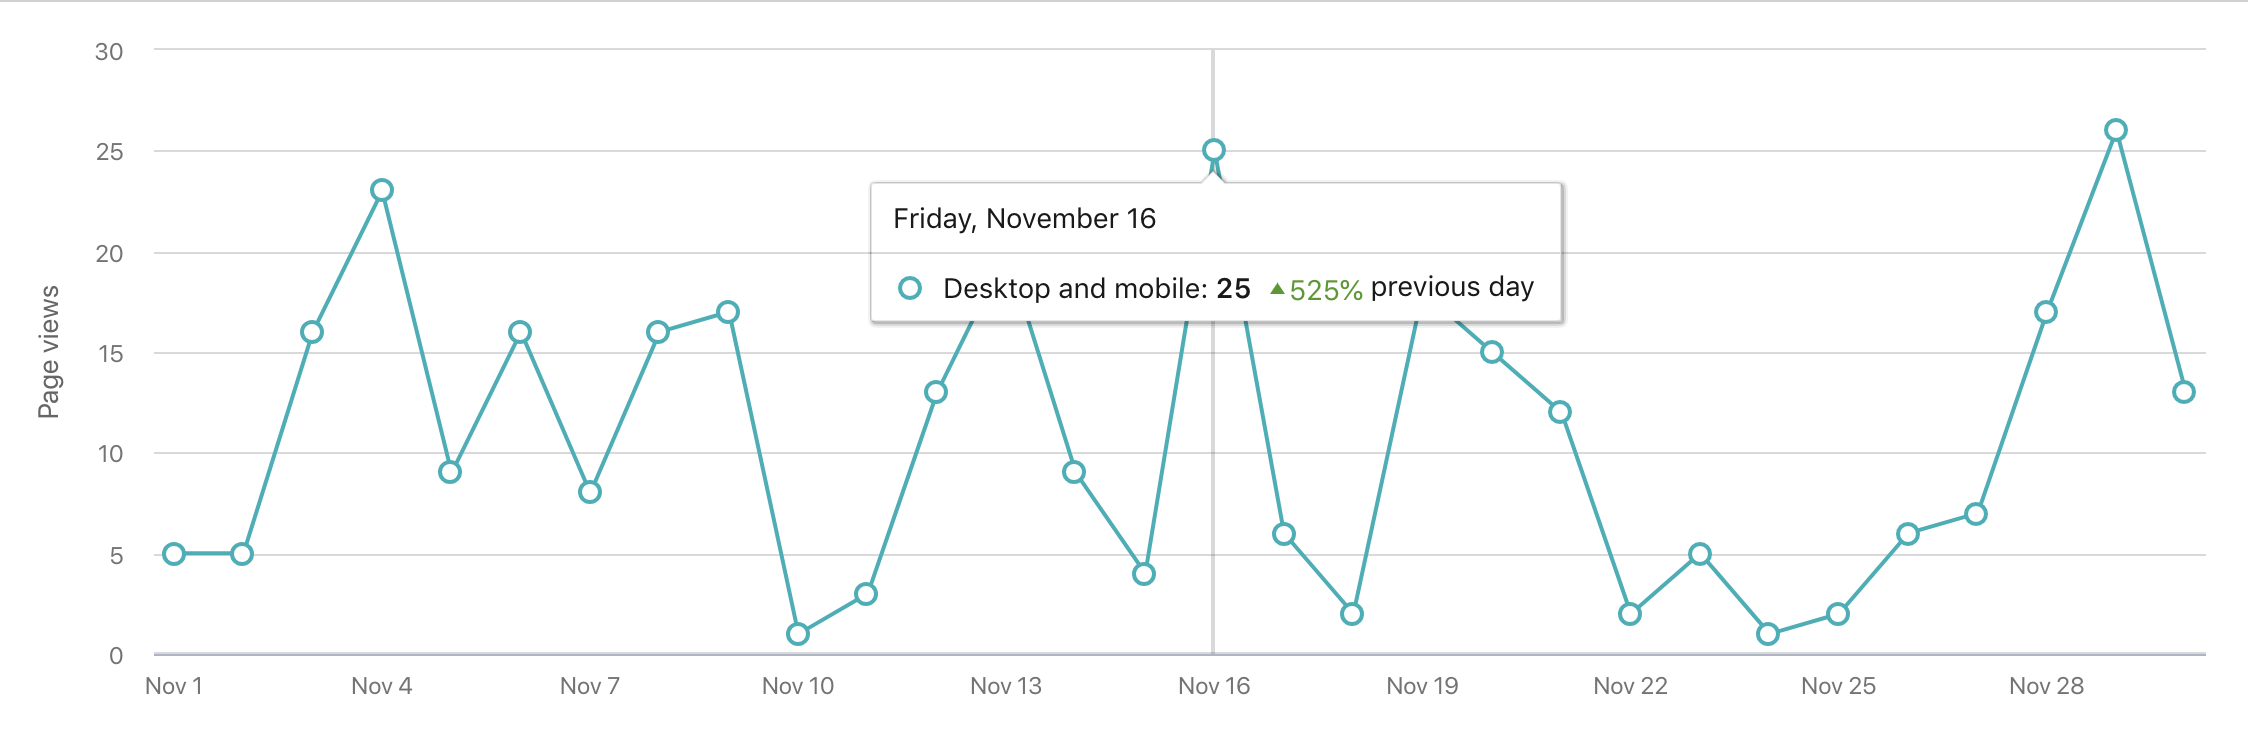
This metric helps you track the reach of your brand, and how well you convert people from aware to followers or observers.
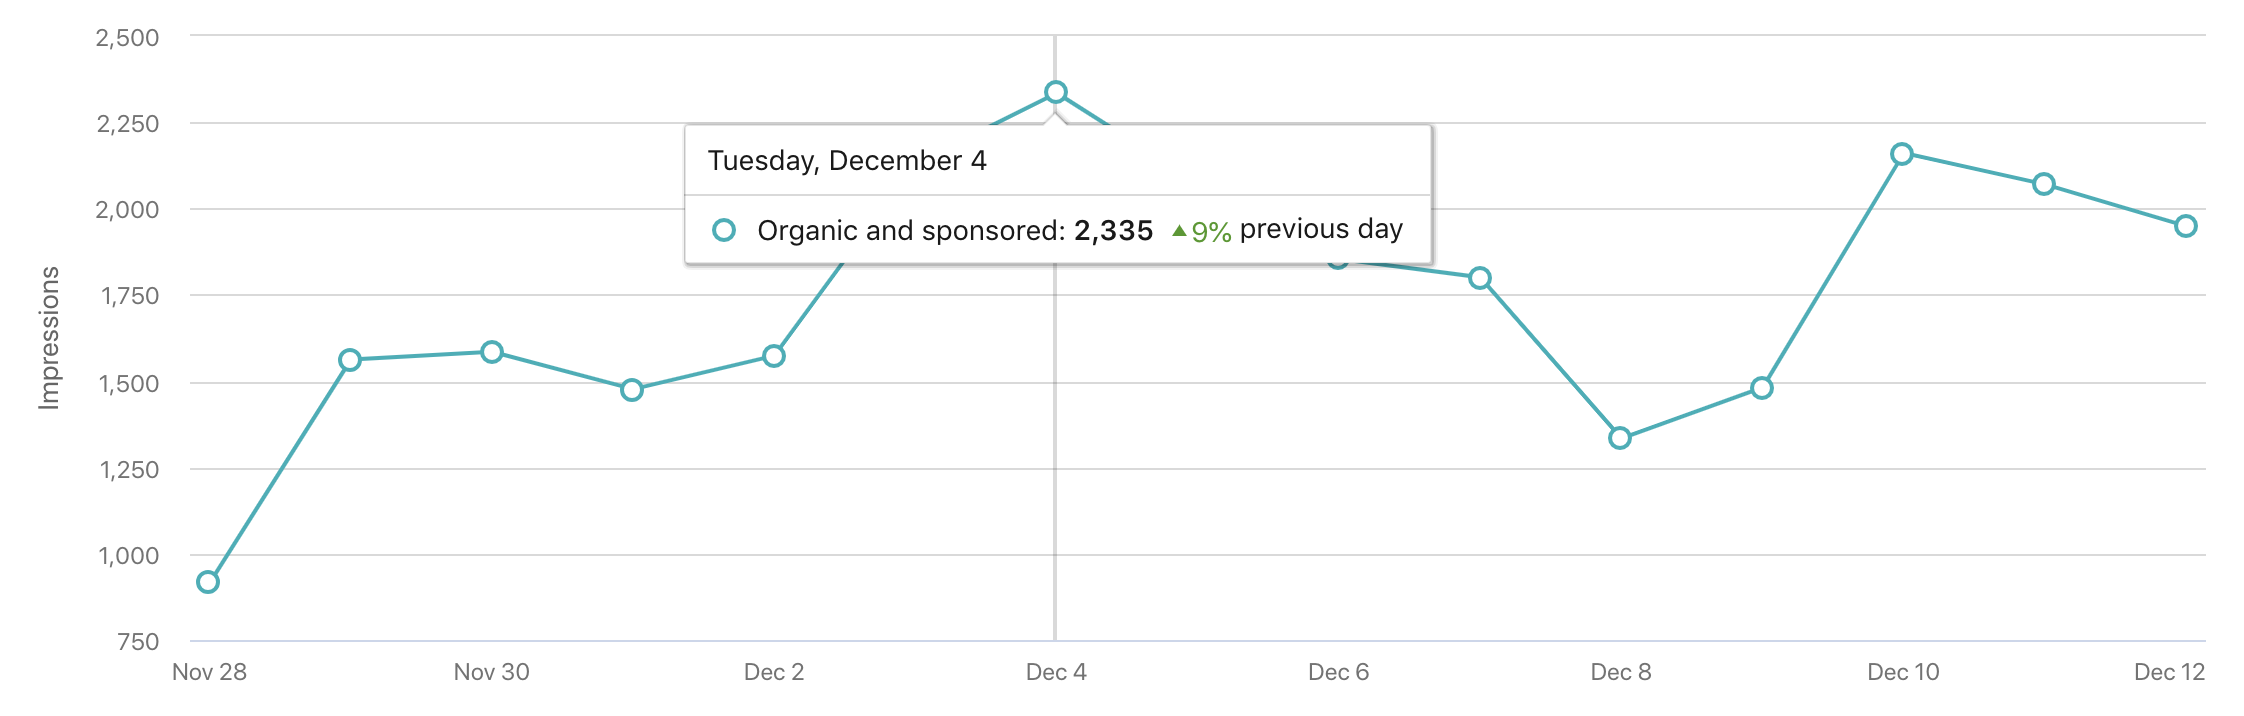
These help you determine your overall reach, community responsiveness, and current growth.
Engagement rate %: The number of people who interacted with your update, based on the total number of impressions.
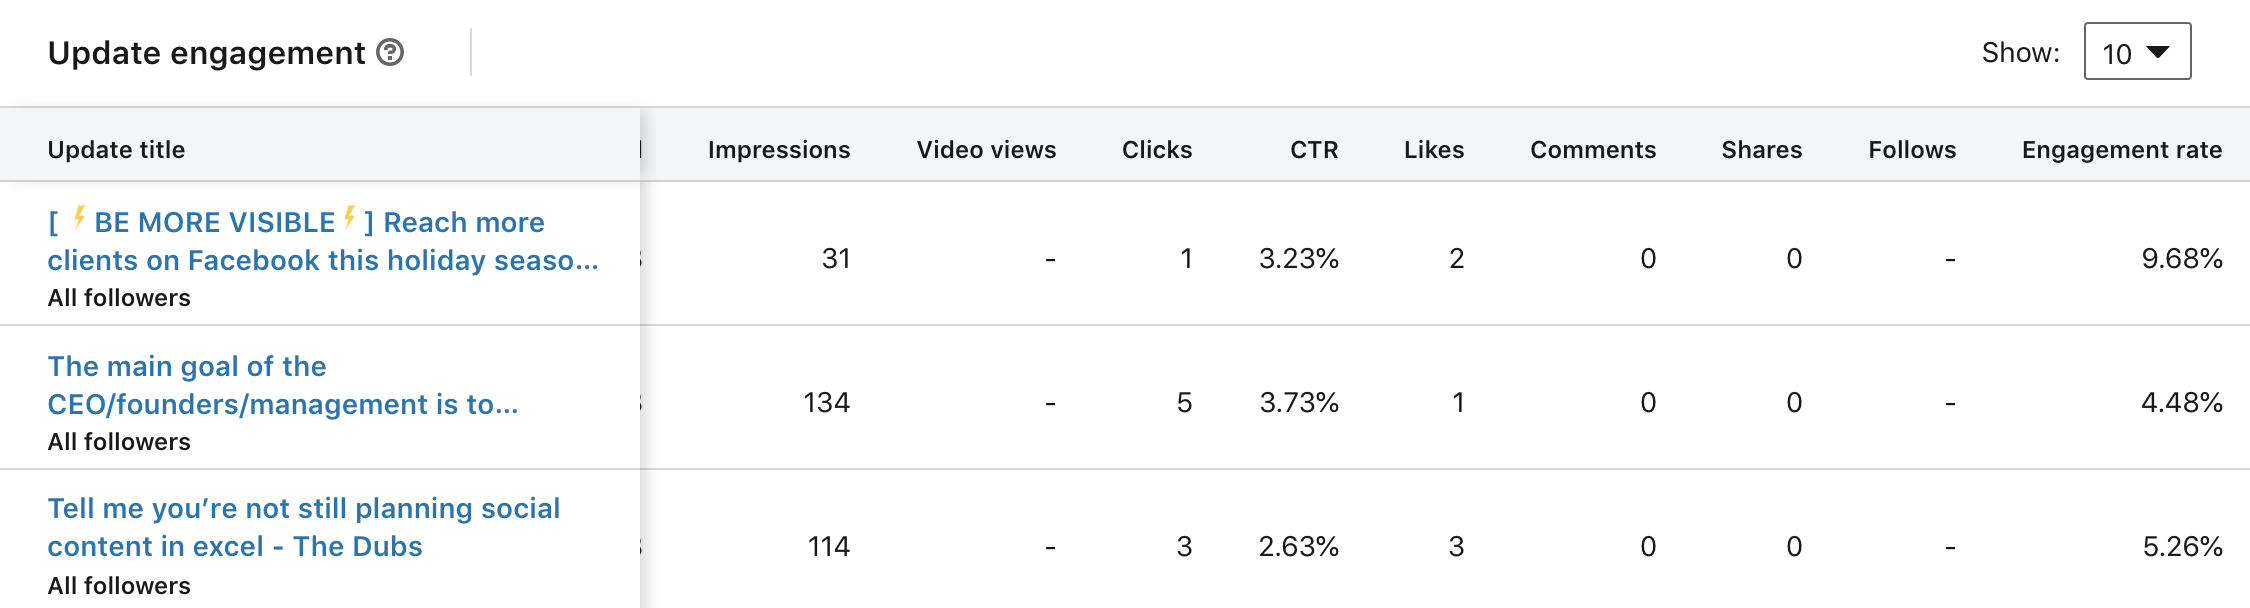
This is a direct indicator of community responsiveness. Also shows your conversions from the observation stage to the following and endorsing stages of the engagement pyramid.
Use this metric to inform your content decisions and understand your audience’s intent.
- Link-Level Metrics
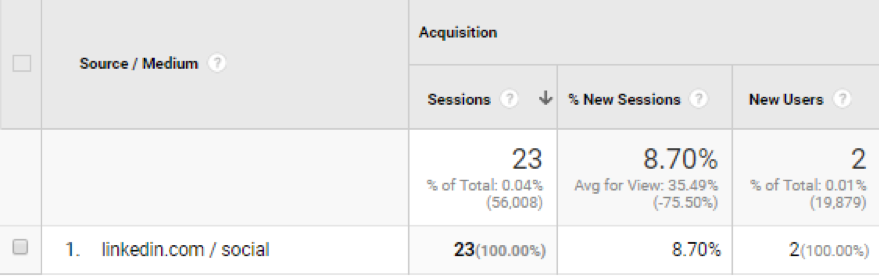
Best tracked with a Google Analytics UTM code or a URL shortener, like Loomly’s URL shortener tool.
YouTube
YouTube is one of the most powerful marketing tools in your arsenal. If you have video at the core of your business, there’s no better place to be, to reach potentially millions of people.
Here’s what you need to track on YouTube.
- Video-Level Metrics
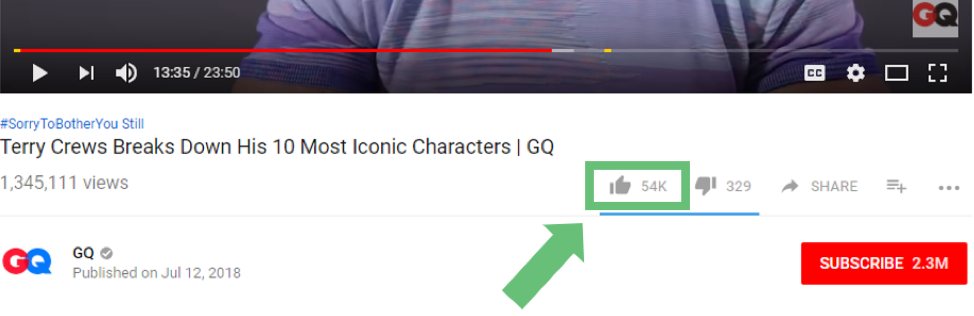
This metric can be used as part of your content and competitive analysis. It also shows your community responsiveness and, in some cases, audience intent.
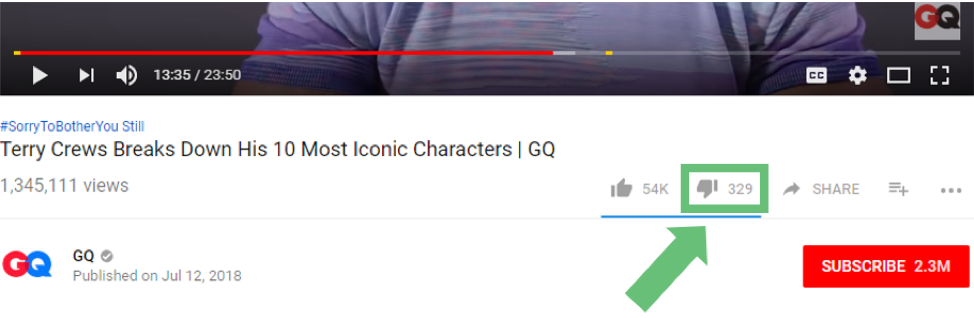
Use this metric as part of your content analysis. However, dislikes aren’t always a bad sign, and can help you determine the correct audience for your content.
A large number of comments is a real plus. But it’s worth combing through and seeing what they say, to understand the audience intent behind them.

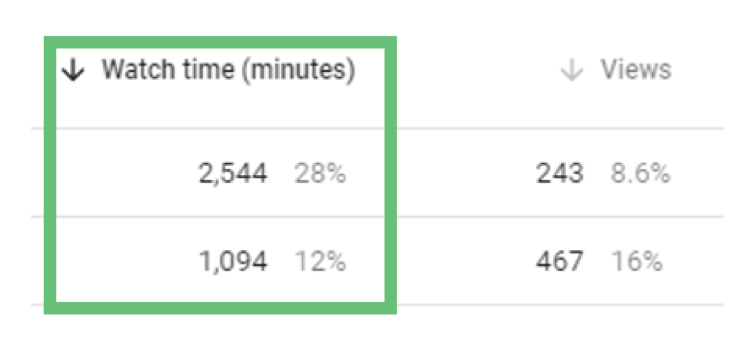
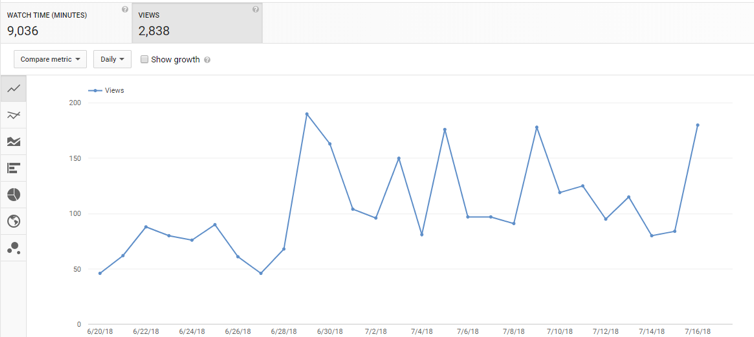
This metric is best used to perform content analysis and track the increase or decrease of your minutes watched.
- Account-Level Metrics
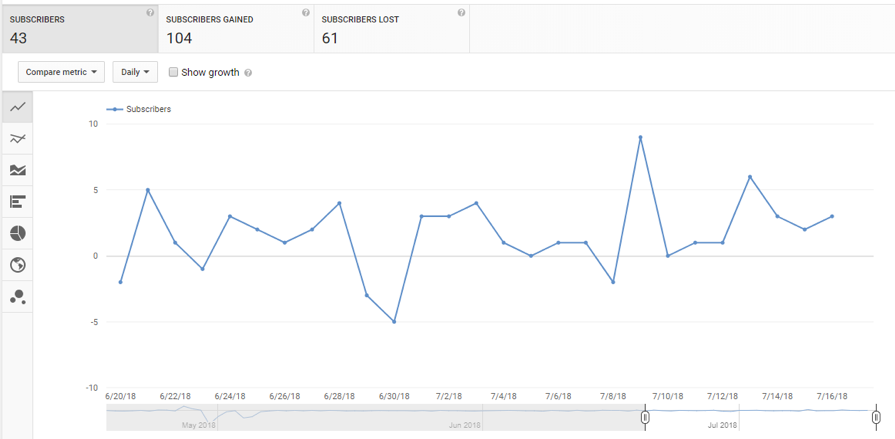
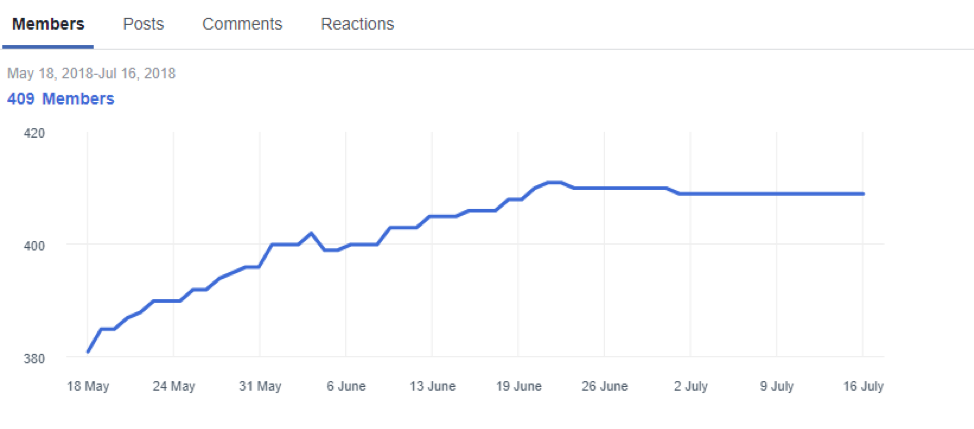
YouTube’s graphs make it easy to track points of key growth (or loss) based on the videos you shared.
You can also see how you attracted these subscribers to your account and how many of them stuck around:
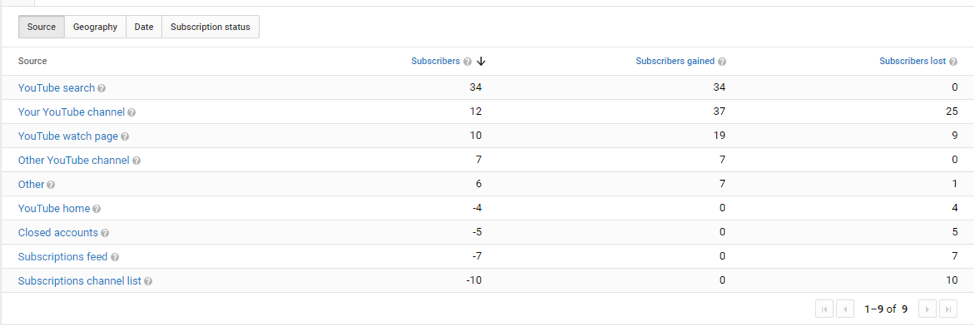
Use this extra layer of information to look for high-performing areas which bring people into the awareness stage of your sales funnel.
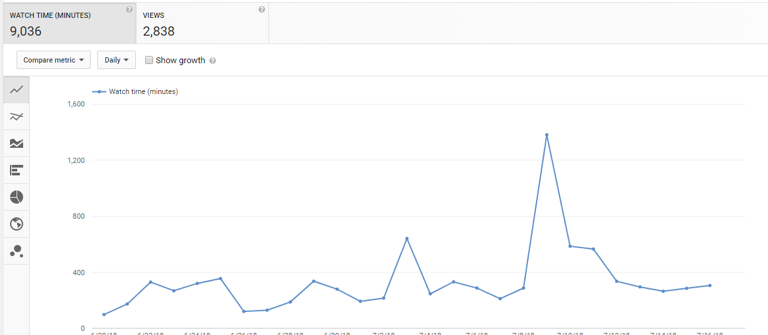
Enables you to see the best days of the week to post, and how engaging your video content is.
Like total watch time, this allows you to see when to post. But it can also be used to find trends in engaging content, and the percentage of people who stay around to watch your entire videos.
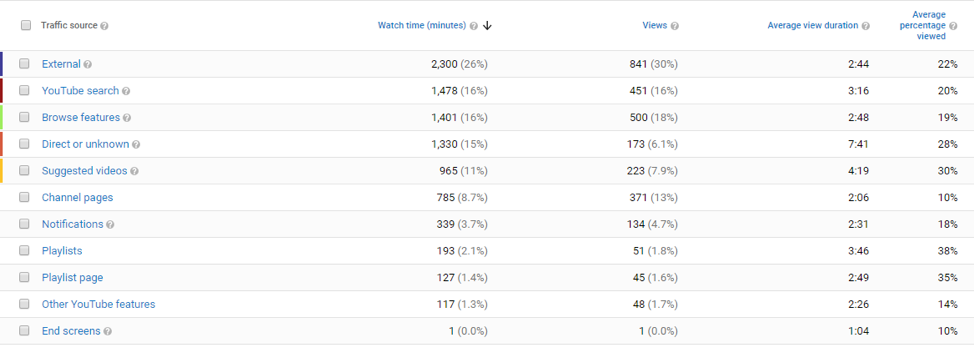
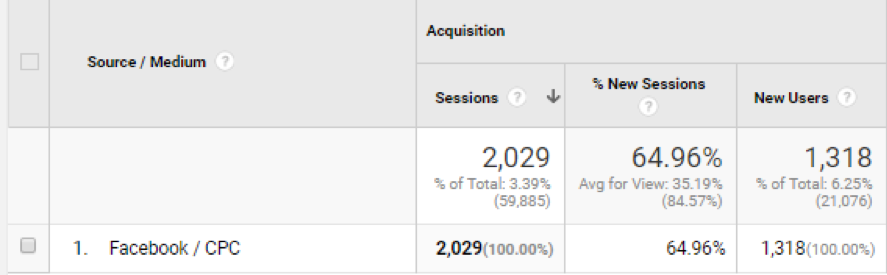
You can see the most effective channels for bringing people into your sales funnel and opportunities to achieve more growth.
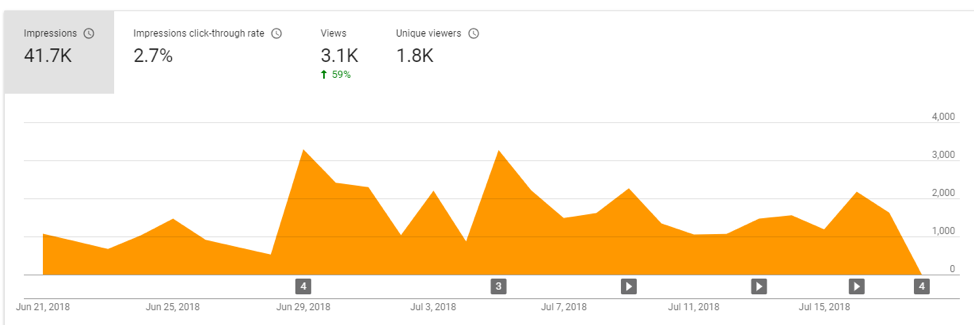
A great metric for the potential reach of your channel.
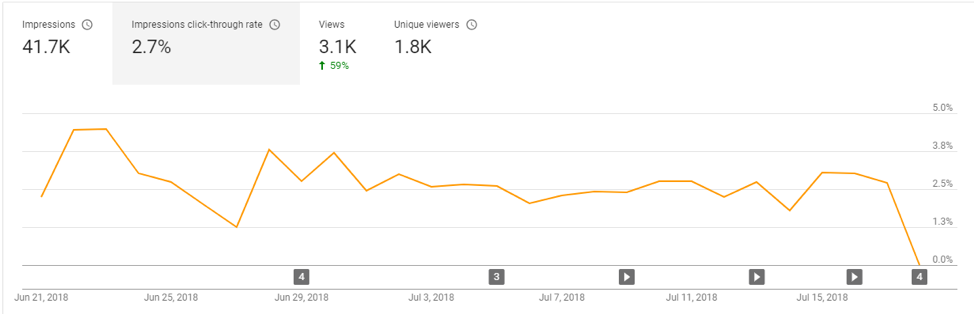
YouTube states the average CTR is between 2% and 10%, but you can try and increase this by testing new headlines and thumbnails.
- Link-Level Metrics
Because YouTube doesn’t provide exact data, this is best tracked with a Google Analytics UTM code, or a URL Shortener like Loomly provides.
Quora
Quora is one of the most underrated platforms for social media marketing.
It gives you the opportunity to perform market research, help users on a one-to-one basis and establish real authority for your brand. All while converting highly targeted people back to your website.
Here are the metrics to track your performance:
- Account And Post-Level Metrics
Can be seen on a daily, weekly, monthly or all term scale.
Use this metric to determine the quality of your answer, and to inform the questions you choose and the answers you leave in your strategy.
Shares are hard to come by on Quora, so this is a positive endorsement for your content. If you find an answer is getting shares, try to replicate the formula.
- Link-Level Metrics
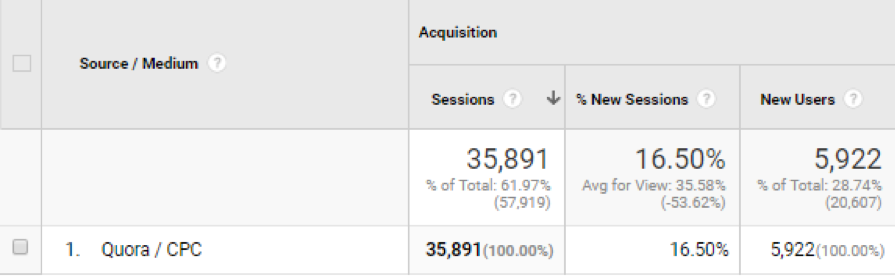
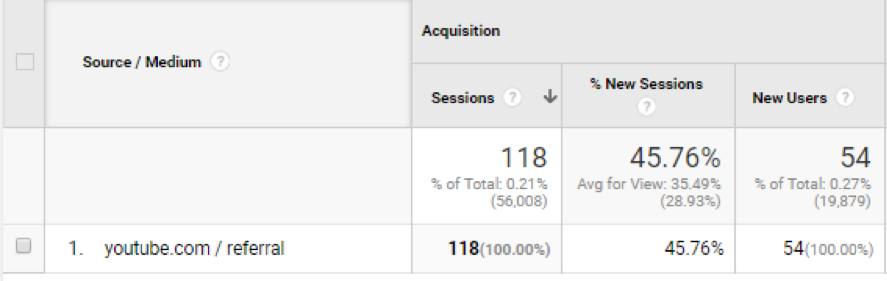
There are lots of ways to receive referral traffic on Quora, like in your bio, throughout your answer or in the citations at the end of your post.
So, you’ll need to use a UTM tracking code or a Loomly URL shortener to track which links generate the most traffic.
Medium
Medium is the social media of blogging. It allows you to put content which may otherwise go unnoticed on your blog in front of hundreds (or thousands) of people.
If you create long-form written content to engage, inform or entertain your reader, you should think about creating a presence here.
Here’s are the metrics to track to measure your Medium marketing performance.
- Post-Level Metrics
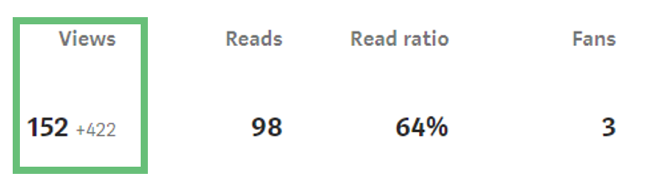
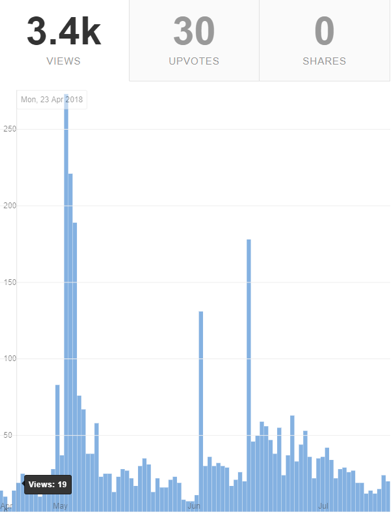
This shows how well your post is reaching people in your target audience.
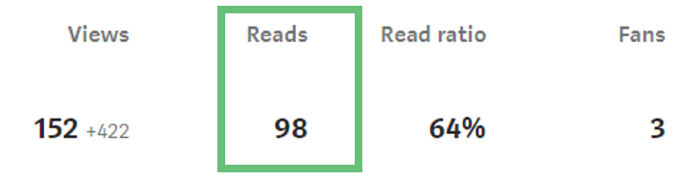
This metric can help you see how well your content converts viewers into readers. It can help you to measure the impact article introductions and in-article copywriting techniques.
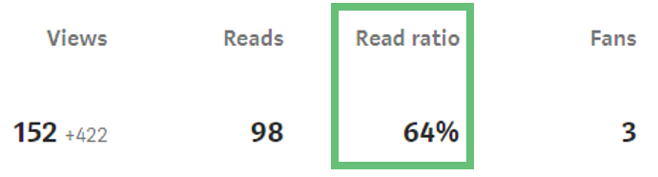
The higher this number, the better the performance of the article.
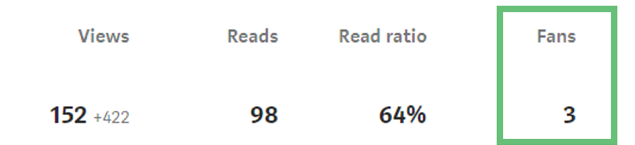
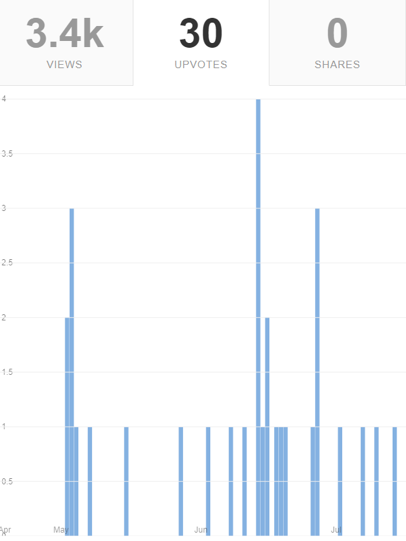
This metric allows you to see the emotional impact of your content. How many people you converted to your cause, or influenced to follow you.
You can also use this metric to test calls to action to subscribe.
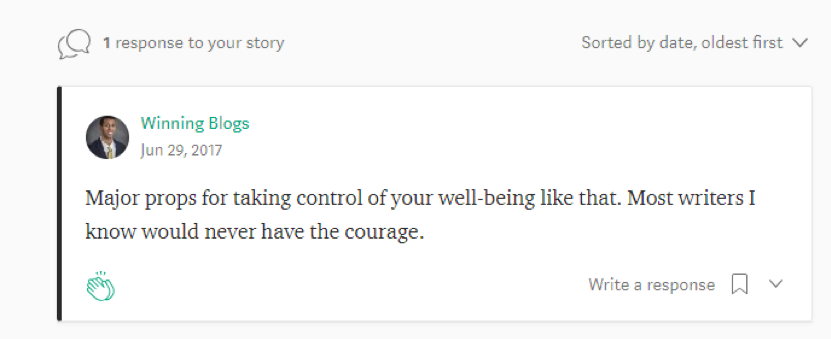
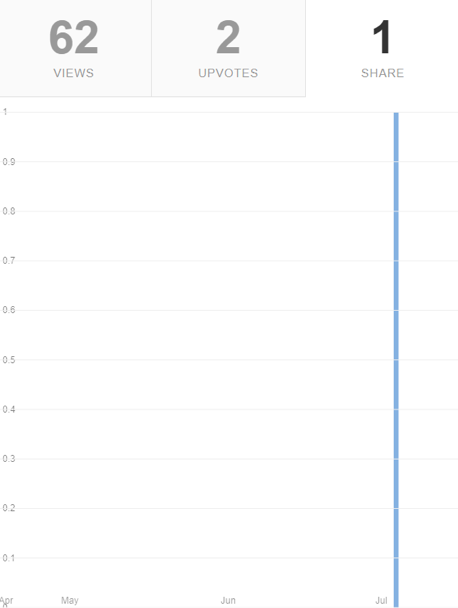
Responses are hard to generate but a brilliant way to track the emotional impact of your posts. They can also contain information to inform future content creation decisions.
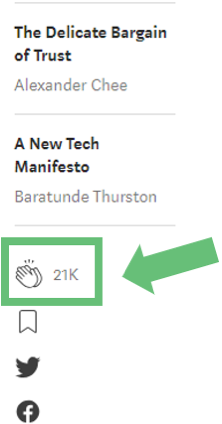
Great way to measure the positive reach of your work, and if your content is being seen by the correct audience.
- Account-Level Metrics
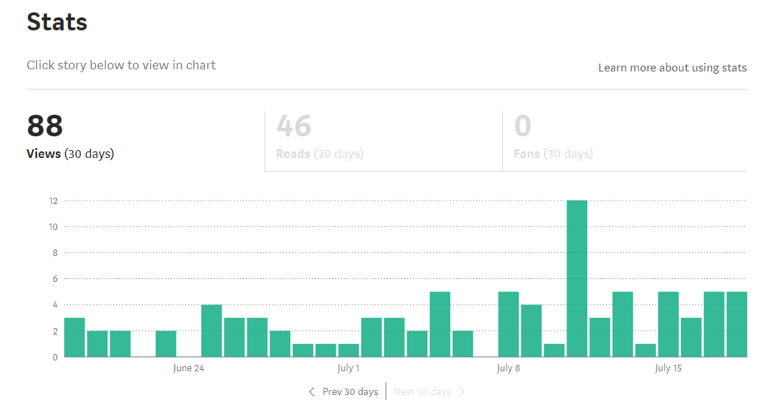
You can compare this with previous periods to track your reach.
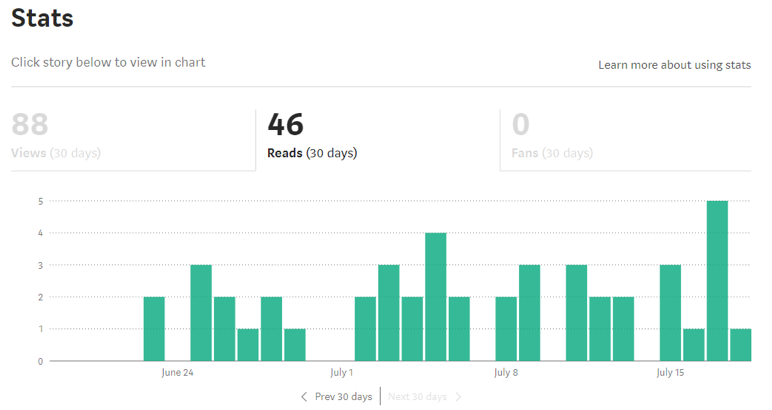
This metric can be used to track the improvement of your content and how engaging it is to readers.
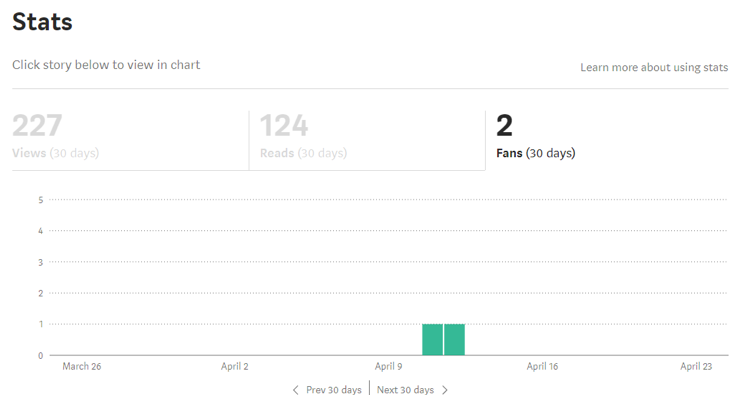
Used to measure the conversion of your content into followers. Being able to see dates followers joined can help you audit your content timing and which pieces of content converted highly.
“Content Doesn’t Win. Optimized Content Wins”
– Liana Evans (@storyspinner)
Unlock Your Superpower: How To Interpret Your Social Media Metrics And Gather Insights
The driving concept behind social media analytics is to see if you are moving toward or away from your goal. So, look at how the data stacks up over the long term.
Your growth (or lack thereof) can be measured on a weekly, monthly, quarterly and yearly basis. This long-term tracking is important. Why?
Because peaks and troughs in your long-term data hold the secret to a better social media strategy.
You can zoom in on the micro-happenings on your feeds to understand their long-term effects. What did you share on a particular day, and how did it change things?
This will give you a great understanding of what content catches on and brings people into your ecosystem. Or, if it was a viral post, you can’t count on replicating.
You can see what caused a fluctuation and begin to decipher why it happened.
Budget is also another important benchmark:
- What are you spending?
- Do you see the correct ROI for your spend?
- Do you need to adjust your strategy or your spend?
This allows you to be proactive and ensure you’re spending your budget correctly, and not just burning cash for the sake of it.
It’s also good practice to benchmark against your industry.
Are you attracting the correct demographics? Are your followers in the right location? Is your growth similar (or better than) your competition?
These insights will help you inform your content strategy and see if you’re improving in the right direction. If your target audience is 30-44-year-old men in Wisconsin, you need to ensure you’re attracting these people. If not, you need to update your strategy.
So, to recap:
- Have clear goals you want to work toward.
- Measure your progress over the long-term.
- Look at the short-term to see the specific cause of a fluctuation.
- Factor for “lucky” viral or crisis posts.
- Check you’re receiving the right ROI from your budget spend.
- Benchmark growth against your industry (and your competitors).
How To Capture And Measure Your Social Media Analytics
You’ve seen the why and the what; now it’s time to look at the how.
Being able to capture and measure your social media analytics is key to seeing your progress and making informed decisions. But, how do you do it?
Well, there are two ways you can do it:
- The “Artisanal” Way: Cheap but hard to manage.
- The “Professional” Way: Costs money but accurate and time efficient.
Let’s look at each of them and decide which one is right for you.
The “Artisanal” Way
If you’re small, scrappy and looking to bootstrap this method is for you.
Each social media platform comes with an analytics dashboard. They vary in user experience and depth of analytics tracking, but in all of them you can:
- Track post and account-level metrics.
- View a limited amount of past data.
- Track your progress in visual graphs and charts.
- Export data to a third-party tool (like Microsoft Excel).
Really this method is as simple as taking the data from a platform, like Facebook, and inputting it into a spreadsheet.
This works as a sort-of social media reporting platform where you can track your self-entered data.
You can also connect this to Microsoft Powerpoint to create your visual chart and graphs, which you’ll need to present your current process to whomever you’re reporting to.
Now, we won’t lie to you:
This method can be time-consuming and a little, well… all over the place.
If you’re trying to grow on multiple platforms, you can find yourself spending most of your time on data-entry and getting the spreadsheet right. Plus, if you input anything incorrectly, it can throw off all of your measurements.
But it can be done with an organized mind and low time pressures.
The “Professional” Way
The most efficient, accurate and time-friendly method is to use a social media analytics tool.
These tools help you track your important metrics, across the right platforms, in one dashboard.
You can schedule posts and see their performance in real-time, with visual and numerical data to inform your strategy. Basically, they consolidate all of your work into one easy-to-manage tool.
Simply connect your accounts, choose your metrics and you’re ready to go.
This leaves you more time to focus on generating ideas, creating content and improving your strategy. I mean, you didn’t get into social media marketing to be filling out Excel spreadsheets, did you?
That’s one of the (many) reasons we chose to create Loomly, and why we consider ourselves to be the social media manager’s best friend.
We wanted to ensure you get the data you need when you need it. So you can spend more time on what you love — creating content and connecting with your audience.
5 Extra Tools To Help You Gather Important Metrics
Whether you choose the artisanal or professional route, you can always use an extra helping hand to track other metrics.
Below is a list of free and paid tools we recommend to help you eek every last ounce of insight out of your analytics data:
- Social Mention: Allows you to see trending topics.
- RiteTag: Helps you to find trending hashtags to use in your content. (If you choose to use Loomly, you’ll also get updates on Twitter trends to inspire your content).
- Mention: See where your brand has been talked about online, and the sentiment behind it.
- Google Analytics: For tracking your traffic and the referrals from your posts. Best used in conjunction with UTM tracking codes.
- Google Attribution: To track spend and monetary attribution.

Wrapping This Up
Social media analytics are essential to your performance as a social media manager. If you want to create an informed strategy capable of taking you towards your goals, you need the data they provide.
While you can track this using the artisanal method in the early days, a professional tool designed to help you track and understand your important metrics will certainly yield better results in terms of productivity and performance on the long run.
That’s why we built Advanced Analytics in Loomly.